Awesome Data Visualization
import pandas as pd
import numpy as np
import re
import seaborn as sns
import ipywidgets as widgets
import matplotlib.pyplot as plt
from mpl_toolkits.mplot3d import axes3d, Axes3D
import folium
from folium import plugins
from statsmodels.graphics.mosaicplot import mosaic
import matplotlib.patches as mpatches
import json
from dateutil.parser import parse
%matplotlib inline
Data Loading
food = pd.read_csv("data/Food_Inspections.csv")
# Find all columns with at least one null value
null_cols=np.sum(food.isnull() , axis=0)
null_cols[null_cols>0]
AKA Name 2451
License # 17
Facility Type 4776
Risk 72
City 138
State 42
Zip 50
Inspection Type 1
Violations 51693
Latitude 682
Longitude 682
Location 682
Historical Wards 2003-2015 194904
Zip Codes 194904
Community Areas 194904
Census Tracts 194904
Wards 194904
dtype: int64
food.shape
(194904, 22)
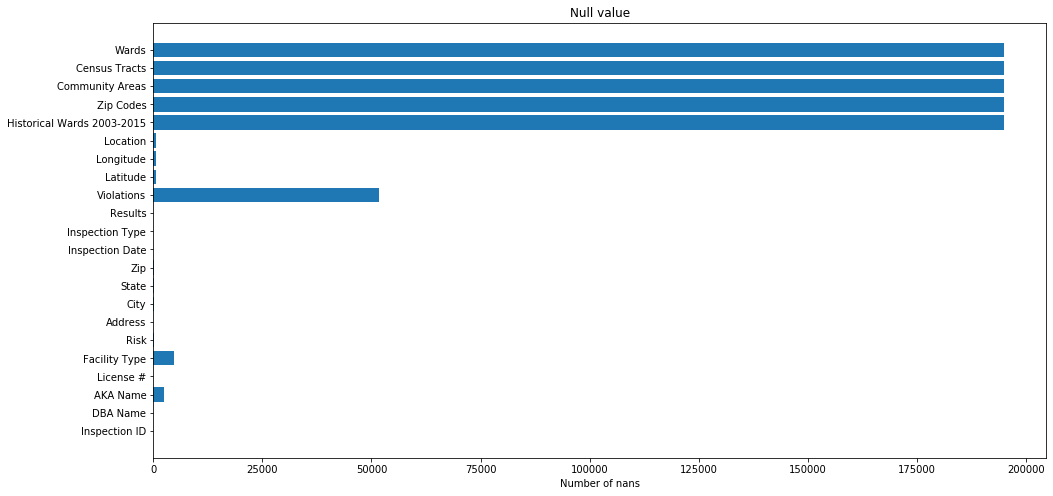
# Lets plot the nans
fig, ax = plt.subplots(figsize=(16,8))
ax.barh(null_cols.index, null_cols.values)
ax.set_title("Null value")
ax.set_xlabel("Number of nans")
Text(0.5, 0, 'Number of nans')
# Data Cleaning & Munging
The columns Historical Wards 2003-2015 , Zip Codes , Community Areas , Census Tracts and Ward are all empty. So we drop them
food.drop(columns=["Historical Wards 2003-2015","Zip Codes", "Community Areas", "Census Tracts", "Wards"],axis=1,inplace=True)
Results
results_count = food["Results"].value_counts(sort=False)
results_count
Pass w/ Conditions 26780
No Entry 6188
Not Ready 1859
Fail 37698
Business Not Located 67
Out of Business 16784
Pass 105528
Name: Results, dtype: int64
fig, ax = plt.subplots(figsize=(8,8))
colors = ['#ff9999','#66b3ff','#99ff99','#ffcc99','#A9BD5A',"#6FBAaD"]
ax.pie(results_count.values,labeldistance=1.05,colors=colors, labels=results_count.index, autopct='%1.1f%%',
startangle=0)
plt.title("Repartition of the results")
Text(0.5, 1.0, 'Repartition of the results')
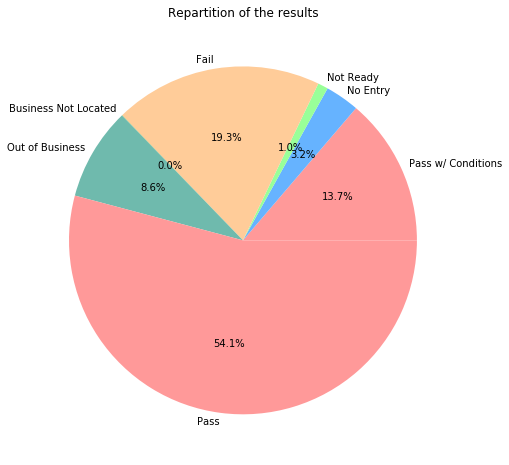
We are interested in business with inspections that pass or fail so we retain those
results=["Pass","Fail","Pass w/ Conditions"]
food=food[food["Results"].isin(results)]
food.shape
(170006, 17)
Inspection Date
food["Inspection Date"].head()
0 10/25/2019
1 10/24/2019
2 10/24/2019
3 10/24/2019
4 10/24/2019
Name: Inspection Date, dtype: object
food["Inspection Date"] = food["Inspection Date"].apply(lambda d: parse(d))
food['Year'] = food["Inspection Date"].map(lambda x: x.year)
food['Month'] = food["Inspection Date"].map(lambda x: x.month)
food['Day'] = food["Inspection Date"].map(lambda x: x.day)
It makes sense to have the dataset in chronological order, so we sort it accordingly
food = food.sort_values(by="Inspection Date")
food.head()
| Inspection ID | DBA Name | AKA Name | License # | Facility Type | Risk | Address | City | State | Zip | Inspection Date | Inspection Type | Results | Violations | Latitude | Longitude | Location | Year | Month | Day | |
|---|---|---|---|---|---|---|---|---|---|---|---|---|---|---|---|---|---|---|---|---|
| 192455 | 67757 | DUNKIN DONUTS/BASKIN-ROBBINS | DUNKIN DONUTS/BASKIN-ROBBINS | 1380279.0 | Restaurant | Risk 2 (Medium) | 100 W RANDOLPH ST | CHICAGO | IL | 60601.0 | 2010-01-04 | Tag Removal | Pass | NaN | 41.884586 | -87.631010 | (-87.63101044588599, 41.88458626715456) | 2010 | 1 | 4 |
| 194205 | 67732 | WOLCOTT'S | TROQUET | 1992039.0 | Restaurant | Risk 1 (High) | 1834 W MONTROSE AVE | CHICAGO | IL | 60613.0 | 2010-01-04 | License Re-Inspection | Pass | NaN | 41.961606 | -87.675967 | (-87.67596676683779, 41.961605669949854) | 2010 | 1 | 4 |
| 193691 | 67733 | WOLCOTT'S | TROQUET | 1992040.0 | Restaurant | Risk 1 (High) | 1834 W MONTROSE AVE | CHICAGO | IL | 60613.0 | 2010-01-04 | License Re-Inspection | Pass | NaN | 41.961606 | -87.675967 | (-87.67596676683779, 41.961605669949854) | 2010 | 1 | 4 |
| 194066 | 67738 | MICHAEL'S ON MAIN CAFE | MICHAEL'S ON MAIN CAFE | 2008948.0 | Restaurant | Risk 1 (High) | 8750 W BRYN WAWR AVE | CHICAGO | IL | 60631.0 | 2010-01-04 | License | Fail | 18. NO EVIDENCE OF RODENT OR INSECT OUTER OPEN... | NaN | NaN | NaN | 2010 | 1 | 4 |
| 193882 | 70269 | mr.daniel's | mr.daniel's | 1899292.0 | Restaurant | Risk 1 (High) | 5645 W BELMONT AVE | CHICAGO | IL | 60634.0 | 2010-01-04 | License Re-Inspection | Pass | NaN | 41.938443 | -87.768318 | (-87.76831838068422, 41.93844282365204) | 2010 | 1 | 4 |
Zip
Since there are only 31 cases with nan zip, we simply drop them
food=food[food["Zip"].notnull()]
zip_=food["Zip"].value_counts().cumsum()/food.shape[0]
zip_=zip_.reset_index()
plt.plot(zip_["Zip"])
plt.title("Zip cumsum")
plt.xlabel("Number of zipcodes")
plt.ylabel("cumulative distribution function")
plt.show()
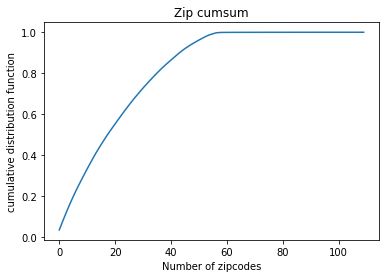
20 Zipcodes out of 110 are where more than half of inspections take place, it’s interesting to check in our further analysis whether these places are just highly dense or are they actually more prone to food inspections
City and State
food[food.State.isnull() & food.City.isnull()]["Address"].unique()
array(['636 N RACINE AVE ', '500 N MILWAUKEE AVE ',
'506 N Milwaukee AVE ', '1438 W CORTLAND ST '], dtype=object)
All Null values in State and City are in Chicago ( checked with the respective adresses)
food[food.State.isnull() & food.City.notnull()]["City"].unique()
array(['CHICAGO'], dtype=object)
Null values in State with a known city are all in Chicago
food[(food.City.isnull()) & (food["State"]!="IL")]["Address"].unique()
array(['636 N RACINE AVE ', '500 N MILWAUKEE AVE ',
'506 N Milwaukee AVE ', '1438 W CORTLAND ST '], dtype=object)
All Null values in City are in Chicago ( checked with the respective adresses)
food["State"].fillna("IL", inplace=True)
food=food[food["State"]=="IL"]
food["City"].fillna("Chicago", inplace=True)
food[food["City"]!="CHICAGO"]["City"].unique()
array(['chicago', 'Chicago', 'CCHICAGO', 'CHESTNUT STREET',
'CHICAGOCHICAGO', 'CHCICAGO', 'CHCHICAGO', 'OAK PARK', 'ALSIP',
'EVERGREEN PARK', 'CHARLES A HAYES', 'EAST HAZEL CREST', 'MAYWOOD',
'Maywood', 'WORTH', 'CHicago', 'BROADVIEW', 'BLUE ISLAND',
'NAPERVILLE', 'FRANKFORT', 'GLENCOE', 'CHICAGOI', 'OAK LAWN',
'CICERO', 'STREAMWOOD', 'OLYMPIA FIELDS', 'BERWYN', 'LAKE ZURICH',
'DES PLAINES', 'BURNHAM', 'SUMMIT', 'BOLINGBROOK',
'COUNTRY CLUB HILLS', 'LOMBARD', 'CHICAGO HEIGHTS', 'TINLEY PARK',
'JUSTICE', 'OOLYMPIA FIELDS', 'ELK GROVE VILLAGE', 'EVANSTON',
'CALUMET CITY', 'SKOKIE', 'Norridge', 'ELMHURST', 'BLOOMINGDALE',
'SCHAUMBURG', 'BANNOCKBURNDEERFIELD', 'BEDFORD PARK', 'BRIDGEVIEW',
'SCHILLER PARK', 'NILES NILES', '312CHICAGO', 'LAKE BLUFF',
'CHICAGOHICAGO', 'PALOS PARK', 'PLAINFIELD', 'HIGHLAND PARK',
'CHICAGO.', 'ROSEMONT', 'WHEATON', 'WADSWORTH', 'LANSING',
'ALGONQUIN'], dtype=object)
Illinois_zipcode=(60001,62999)
suburbs_zipcode=food[food["City"]!="CHICAGO"]["Zip"].unique()
# All the suburbs are within the Illinois zipcode range
all(Illinois_zipcode[0]<=city_zipcode<=Illinois_zipcode[1] for city_zipcode in suburbs_zipcode)
True
All these values are either typos for Chicago or Chicago suburbs (checked by zip code), so we keep them.
Since the columns City and State don’t give us relevant information, we drop them
food=food.drop(columns=["City","State"])
Location
# Fill the null location values with default Chicago location
default_lat=41.85003
default_long=-87.65005
default_location='(-87.65005,41.85003)'
food[food["Location"]==default_location]
| Inspection ID | DBA Name | AKA Name | License # | Facility Type | Risk | Address | Zip | Inspection Date | Inspection Type | Results | Violations | Latitude | Longitude | Location | Year | Month | Day |
|---|
No other business has this location, so we can drop it when we need to plot
food["Latitude"].fillna(default_lat,inplace=True)
food["Longitude"].fillna(default_long,inplace=True)
food["Location"].fillna(default_location,inplace=True)
food_plot = food[food["Location"] != default_location]
m = folium.Map([41.85003, -87.65005], zoom_start=10)
sample_locaions = food_plot.sample(30000)[["Latitude", "Longitude"]].values
m.add_child(plugins.HeatMap(sample_locaions.tolist(), radius=10))
m
License number
food[food["License #"].isnull()].shape
(16, 18)
food.groupby("License #").Location.nunique().sort_values(ascending=False).head()
License #
0.0 192
2458393.0 3
2225602.0 2
46041.0 2
2511398.0 2
Name: Location, dtype: int64
Since there are 16 nans, and we see that a lot of unidentified license are set to 0, we set them also to 0
food["License #"].fillna(0,inplace=True)
Violations
As seen in the dataset description:
An establishment can receive one or more of 45 distinct violations (violation numbers 1-44 and 70). For each violation number listed for a given establishment, the requirement the establishment must meet in order for it to NOT receive a violation is noted, followed by a specific description of the findings that caused the violation to be issued.
For the null values in Violations, we will just replace them with “0. None reported” since the violations are numbered
food["Violations"].fillna("0. None Reported", inplace=True)
It’s specified in the Food Inspection Reporting System (https://webapps1.chicago.gov/healthinspection/Code_Violations.jsp#1crit) that we can have 3 types of violation :
-For violation number 1-14 it refers to critical violations.
-For violation number 15-29 it refers to serious violations.
-For the rest it refers to no critical violations,minor (30-44,70).
For each inspection we have a list of a description of each violation discovered, the description is composed of 3 elements:
-The violation number
-The violation title
-Comments
Therefore we parse the descriptions to separate the 3 entities.
# Initiating the 3 columns
violation_number = []
violation_title = []
violation_comment = []
# Initiating the exploded dataframe with 4 columns : ids, number , title and comments
number_exploded = []
ids_exploded = []
title_exploded = []
comment_exploded = []
def violation_parsing(row):
"""
This function iterates over the Violations columns in the original dataset and returns three seperate columns:
Violation number, title and comments
Also, it returns a new dataframe where all seperate violations tuples have unique rows
"""
# spliting seperate violations
list_violation= row['Violations'].split(' | ')
numbers = []
titles = []
comments = []
for vl in list_violation:
ids_exploded.append(row['Inspection ID'])
# splitting the title from the comments
comment_splited = vl.split('- Comments:')
# splitting the number from the title
split_point = comment_splited[0].split('.')
# appending the number
numbers.append(split_point[0])
number_exploded.append(split_point[0])
#appending the title
titles.append(split_point[1].strip())
title_exploded.append(split_point[1].strip())
# checking whether a comment exists and then appending it, otherwise we append an empty comment
if(len(comment_splited) <= 1):
comments.append("")
comment_exploded.append("")
else:
comments.append(comment_splited[1].strip())
comment_exploded.append(comment_splited[1].strip())
violation_number.append(numbers)
violation_title.append(titles)
violation_comment.append(comments)
food.apply(violation_parsing,axis=1)
violation_exploded = pd.DataFrame({"ids": ids_exploded ,"numbers" : number_exploded , "titles" : title_exploded, "comments" : comment_exploded})
food ['Violation numbers'] =violation_number
food ['Violation title']=violation_title
food ['Violation comments']=violation_comment
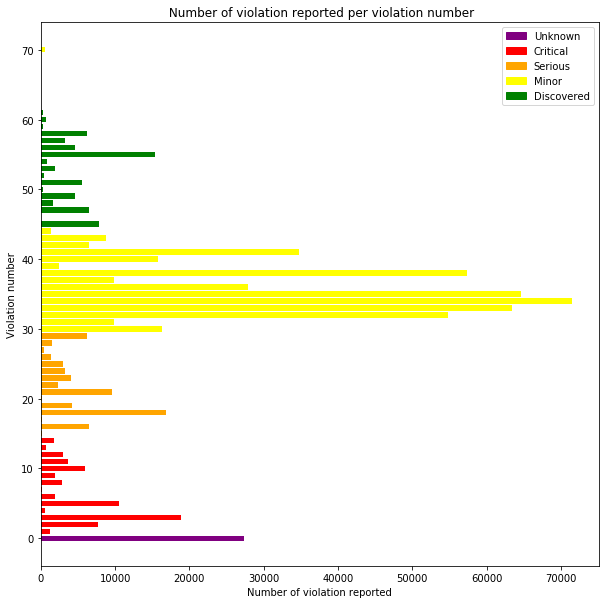
# showing all different violation codes
count_violation = violation_exploded.groupby(['numbers']).comments.count()
count_violation.index = count_violation.index.map(lambda x: int(x))
count_violation = count_violation.sort_index()
count_violation.index
Int64Index([ 0, 1, 2, 3, 4, 5, 6, 7, 8, 9, 10, 11, 12, 13, 14, 15, 16,
17, 18, 19, 20, 21, 22, 23, 24, 25, 26, 27, 28, 29, 30, 31, 32, 33,
34, 35, 36, 37, 38, 39, 40, 41, 42, 43, 44, 45, 46, 47, 48, 49, 50,
51, 52, 53, 54, 55, 56, 57, 58, 59, 60, 61, 62, 63, 70],
dtype='int64', name='numbers')
We are surprised to find violation numbers that are above 44 ! This is really weird as it was not specified in the Food Inspection Reporting System.
# showing their respective titles
weird_cases = violation_exploded[(violation_exploded['numbers'].astype(int) > 44) & (violation_exploded['numbers'] != "70") ]
weird_cases.groupby(['numbers']).titles.value_counts()
numbers titles
45 FOOD HANDLER REQUIREMENTS MET 7475
SINGLE-USE/SINGLE-SERVICE ARTICLES: PROPERLY STORED & USED 415
46 GLOVES USED PROPERLY 76
47 FOOD & NON-FOOD CONTACT SURFACES CLEANABLE, PROPERLY DESIGNED, CONSTRUCTED & USED 6514
48 WAREWASHING FACILITIES: INSTALLED, MAINTAINED & USED; TEST STRIPS 1669
49 NON-FOOD/FOOD CONTACT SURFACES CLEAN 4649
50 HOT & COLD WATER AVAILABLE; ADEQUATE PRESSURE 281
51 PLUMBING INSTALLED; PROPER BACKFLOW DEVICES 5526
52 SEWAGE & WASTE WATER PROPERLY DISPOSED 374
53 TOILET FACILITIES: PROPERLY CONSTRUCTED, SUPPLIED, & CLEANED 1965
54 GARBAGE & REFUSE PROPERLY DISPOSED; FACILITIES MAINTAINED 849
55 PHYSICAL FACILITIES INSTALLED, MAINTAINED & CLEAN 15320
56 ADEQUATE VENTILATION & LIGHTING; DESIGNATED AREAS USED 4656
57 ALL FOOD EMPLOYEES HAVE FOOD HANDLER TRAINING 3299
58 ALLERGEN TRAINING AS REQUIRED 6277
59 PREVIOUS PRIORITY FOUNDATION VIOLATION CORRECTED 299
60 PREVIOUS CORE VIOLATION CORRECTED 712
61 SUMMARY REPORT DISPLAYED AND VISIBLE TO THE PUBLIC 246
62 COMPLIANCE WITH CLEAN INDOOR AIR ORDINANCE 39
63 REMOVAL OF SUSPENSION SIGN 13
Name: titles, dtype: int64
colors = ["Purple"] + ["red"] * 14 + ["orange"] * 15 + ["yellow"] *15 + ["green"] *19 + ["yellow"]
df_count = pd.DataFrame({'number' : count_violation.index, 'count' : count_violation.values, 'color' : colors} )
# plotting violations frequencies
fig, ax = plt.subplots(figsize=(10,10))
ax.barh(df_count['number'] ,df_count['count'], color = df_count['color'])
UK = mpatches.Patch(color='purple', label='Unknown')
CR = mpatches.Patch(color='red', label='Critical')
SR = mpatches.Patch(color='orange', label='Serious')
MI = mpatches.Patch(color='yellow', label='Minor')
DS = mpatches.Patch(color='green', label='Discovered')
plt.legend(handles=[UK,CR,SR,MI,DS], loc=1)
plt.xlabel("Number of violation reported")
plt.ylabel("Violation number")
plt.title(" Number of violation reported per violation number")
plt.show()
For each inspection we consider a score that counts the number of violations per type of violation (minor,serious,critical).
The new violation numbers (44-63) are grouped with the minor violations.
def score(numbers):
""" This function creates a score for the violation according to its category (minor,serious,critical)
and returns the score as a tuple
"""
minor = 0
serious = 0
critical = 0
for number in numbers:
number = int(number)
if( (number >=1) & (number <=14) ):
critical+=1
elif ((number >=15) and (number <=29) ) :
serious+=1
elif (number >29) :
minor+=1
return minor,serious,critical
food['Violation score minor'] = food ['Violation numbers'].map(lambda x : score(x)[0])
food['Violation score serious'] = food ['Violation numbers'].map(lambda x : score(x)[1])
food['Violation score critical'] = food ['Violation numbers'].map(lambda x : score(x)[2])
Depending on that score we want to know how the results evolve.
#group by score and count the the number of inspection
violation_score = food.groupby(['Violation score minor','Violation score serious','Violation score critical']).Results.value_counts().unstack().reset_index()
violation_score.fillna(0, inplace=True)
#transforming the count to an empirical probability
sums = violation_score.loc[:, ['Fail','Pass','Pass w/ Conditions']].sum(axis=1).values.reshape((-1,1))
violation_score.loc[:,['Fail','Pass','Pass w/ Conditions']]= violation_score.loc[:,['Fail','Pass','Pass w/ Conditions']] /sums
violation_score.head()
| Results | Violation score minor | Violation score serious | Violation score critical | Fail | Pass | Pass w/ Conditions |
|---|---|---|---|---|---|---|
| 0 | 0 | 0 | 0 | 0.113151 | 0.870763 | 0.016086 |
| 1 | 0 | 0 | 1 | 0.361307 | 0.042403 | 0.596290 |
| 2 | 0 | 0 | 2 | 0.114050 | 0.019835 | 0.866116 |
| 3 | 0 | 0 | 3 | 0.205479 | 0.000000 | 0.794521 |
| 4 | 0 | 0 | 4 | 0.300000 | 0.000000 | 0.700000 |
#We create a 3D space representing the score space and we plot the probability to fail in that space
%matplotlib notebook
fig = plt.figure(figsize=(10,5))
ax = Axes3D(fig)
p=ax.scatter3D(violation_score['Violation score minor'], violation_score['Violation score serious'], violation_score['Violation score critical'], c=violation_score['Fail'], cmap='YlOrRd',s=30)
ax.set_xlabel('Violation score minor')
ax.set_ylabel('Violation score serious')
ax.set_zlabel('Violation score critical')
ax.set_title("Probaiblity to fail with the number of failed violations")
fig.colorbar(p,label="Probability to fail")
plt.show()
<IPython.core.display.Javascript object>

<IPython.core.display.Javascript object>
We can observe in this 3D plot the probability to fail depending on the number of violations per category. Depending on the axis we can observe that the increase of the violations has a different impact on the probability to fail. The violation score minor doesn’t affect the probability to fail where as when we start to increase just a little bit the serious or critical score the probability to fail becomes very close to 1.
#plotting the probability to pass in the space of the score
fig = plt.figure(figsize=(10,5))
ax = Axes3D(fig)
p = ax.scatter3D(violation_score['Violation score minor'], violation_score['Violation score serious'], violation_score['Violation score critical'], c=violation_score['Pass'], cmap='YlOrRd',s=40)
ax.set_xlabel('Violation score minor')
ax.set_ylabel('Violation score serious')
ax.set_zlabel('Violation score critical')
ax.set_title("Probaiblity to pass with the number of failed violations")
fig.colorbar(p,label="Probability to pass")
plt.show()
<IPython.core.display.Javascript object>
<IPython.core.display.Javascript object>
We observe that the violation score minor doesn’t affect the probability to pass. We also see that there is a high probability to pass if there are very few serious and critical violation scores
#plotting the probability to pass with condition in the space of the score
fig = plt.figure(figsize=(10,5))
ax = Axes3D(fig)
p = ax.scatter3D(violation_score['Violation score minor'], violation_score['Violation score serious'], violation_score['Violation score critical'], c=violation_score['Pass w/ Conditions'], cmap='YlOrRd',s=40)
ax.set_xlabel('Violation score minor')
ax.set_ylabel('Violation score serious')
ax.set_zlabel('Violation score critical')
ax.set_title("Probaiblity to Pass w/ Conditions with the number of failed violations")
fig.colorbar(p,label="Probability to pass with condition")
plt.show()
<IPython.core.display.Javascript object>
<IPython.core.display.Javascript object>
In this plot we can see that if you have low scores you will not pass with condition because you will just pass and if you have high scores you will fail. We can observe that if you have a lot of minor violations you have a high probability to pass with conditions .
food.groupby('Results')['Violation score minor'].mean()
Results
Fail 3.941411
Pass 2.492176
Pass w/ Conditions 3.540392
Name: Violation score minor, dtype: float64
food.groupby('Results')['Violation score serious'].mean()
Results
Fail 1.156398
Pass 0.003592
Pass w/ Conditions 0.590140
Name: Violation score serious, dtype: float64
food.groupby('Results')['Violation score critical'].mean()
Results
Fail 0.719312
Pass 0.004350
Pass w/ Conditions 1.231335
Name: Violation score critical, dtype: float64
Facility Type
food["Facility Type"]=food["Facility Type"].str.casefold()
# We can check different grocery store types and set them all to "grocery store"
groceries=food[["grocer" in str(facility) for facility in food["Facility Type"]]]["Facility Type"]
groceries.unique()
array(['grocery store', 'grocery& restaurant', 'slaughter house/ grocery',
'grocery/cafe', 'gas station/ grocery store',
'grocery(sushi prep)', 'pharmacy/grocery', 'grocery and butcher',
'grocery/butcher', 'grocery/restaurant', 'grocery store/bakery',
'drug/grocery store', 'grocery store/taqueria', 'grocery/liquor',
'grocery/taqueria', 'gas station /grocery', 'restaurant/grocery',
'grocery & restaurant', 'restaurant/grocery store',
'grocery store/cooking school', 'grocery/ restaurant',
'rest/grocery', 'grocery store/ restaurant',
'grocery store/gas station', 'drug store/grocery', 'grocery',
'grocery/dollar store', 'grocery/service gas station',
'gas station/store grocery', 'grocery/bakery',
'dollar store selling grocery', 'grocery store/deli',
'grocery store / gas station', 'bakery/grocery',
'grocery/gas station', 'grocery/tavern', 'grocery/liquor store',
'grocery/drug store', 'dollar & grocery store',
'deli/grocery store', 'grocery(gas station)', 'grocery/deli',
'gas station/grocery', 'dollar store with grocery',
'grocery store /pharmacy'], dtype=object)
food.loc[["grocer" in str(facility) for facility in food["Facility Type"]],"Facility Type"]="grocery store"
fvc=food["Facility Type"].value_counts()
fvc[fvc>20].head(10)
restaurant 114651
grocery store 22308
school 11720
children's services facility 2864
bakery 2508
daycare (2 - 6 years) 2373
daycare above and under 2 years 2193
long term care 1277
catering 988
mobile food dispenser 795
Name: Facility Type, dtype: int64
print("We have {0} other categories for a total number of {1} businesses".format(fvc[fvc<20].shape[0], fvc[fvc<20].sum()))
We have 330 other categories for a total number of 1481 businesses
fvc[fvc<20].head(20)
after school program 19
roof top 19
mobile desserts vendor 18
hotel 18
nursing home 18
paleteria 18
wrigley roof top 17
gas station/mini mart 17
rooftops 16
supportive living 16
brewery 16
fitness center 15
pop-up establishment host-tier ii 15
university cafeteria 15
theatre 15
long term care facility 15
mobile food truck 14
wrigley rooftop 14
health/ juice bar 14
airport lounge 14
Name: Facility Type, dtype: int64
We don’t see a proper way to aggregate these outliers, so it might be interesting to set them to other
lower_than_20 = fvc[fvc<20].index
food.loc[food["Facility Type"].isin(lower_than_20),"Facility Type"] ="other"
For the null values in Facility Type, we will just replace them with “Unspecified”
food["Facility Type"].fillna("Unspecified", inplace=True)
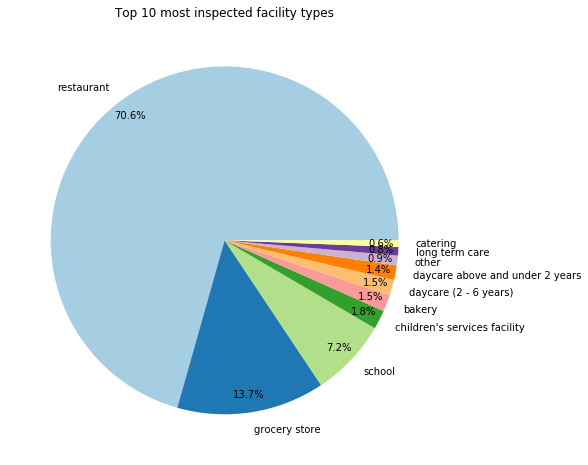
Now we can see a proper distribution for the top 10 facilities
%matplotlib inline
top10_facilities=food["Facility Type"].value_counts().head(10)
fig1, ax1 = plt.subplots(figsize=(8,8))
theme = plt.get_cmap('Paired')
ax1.set_prop_cycle("color", [theme(1. * i / 10)
for i in range(10)])
ax1.set_title("Top 10 most inspected facility types")
ax1.pie(top10_facilities.values,labeldistance=1.1, labels=top10_facilities.index, autopct='%1.1f%%',
pctdistance=0.9, startangle=0)
plt.show()
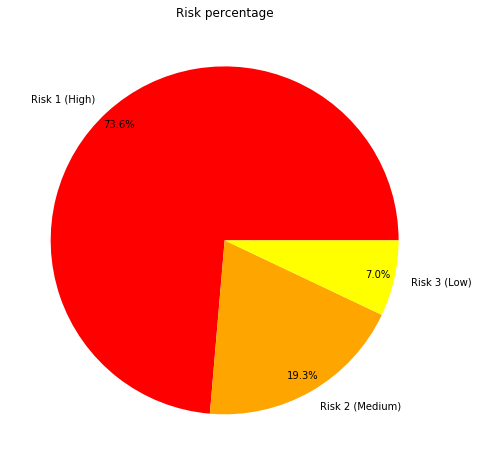
Risk
food["Risk"].value_counts()
Risk 1 (High) 125149
Risk 2 (Medium) 32808
Risk 3 (Low) 11976
All 5
Name: Risk, dtype: int64
5 entries are marked as Risk : ALL . As we don’t know the meaning of it and that those entries contain many null values, We choose to drop these entries
food=food[food["Risk"]!="All"].copy()
food[food["Risk"].isnull()]["Inspection ID"].count()
34
34 entries in Risk are null, since there is no appropiate way to impute them, we choose to drop them
food=food[food["Risk"].notnull()]
Let’s try to understand how risk is distributed
risk_count=food["Risk"].value_counts()
fig, ax = plt.subplots(figsize=(8,8))
ax.set_title("Risk percentage")
ax.pie(risk_count.values,labeldistance=1.1,colors=["red","orange","yellow"], labels=risk_count.index, autopct='%1.1f%%',
pctdistance=0.9, startangle=0)
plt.show()
Let’s see their correlation with the results of inspections
fig, ax = plt.subplots(figsize=(12,8))
props = lambda key: {'color': "yellowgreen" if "Pass" in key else "tomato" if "Fail" in key else "gold"}
mosaic(food,["Risk","Results"], ax=ax ,properties=props)
plt.title("Mosaic of Risk and Results categories")
plt.show()
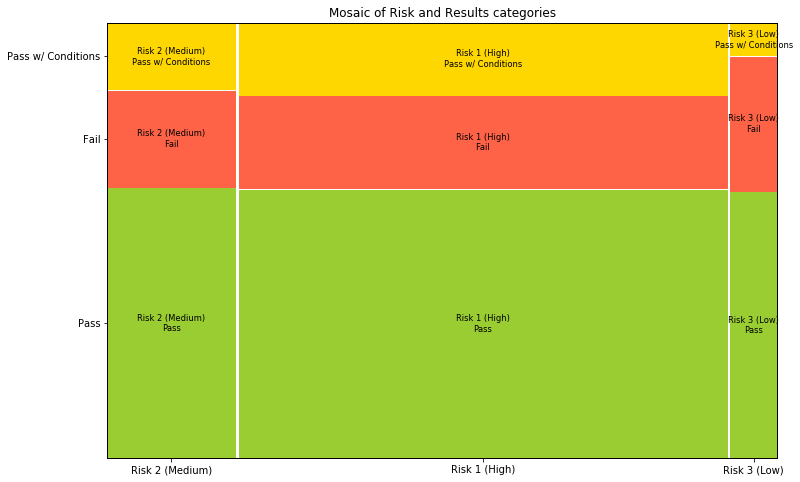
We see that the pass percentage doesn’t really depend on the risk type, although facilities with low risk have slightly more chance to fail
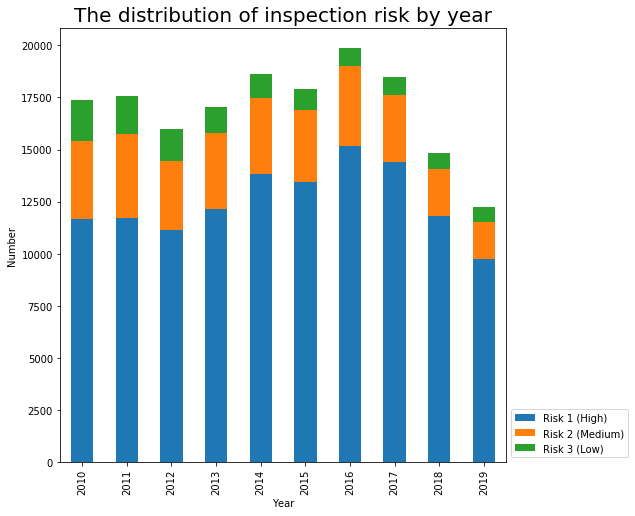
Let’s observe the evolution of the risk thought time.
year_inspection_risk = pd.DataFrame(food.groupby(['Year','Risk'])['Inspection ID'].count()).reset_index()
year_inspection_risk = year_inspection_risk.pivot(index='Year', values='Inspection ID', columns='Risk')
year_inspection_risk.fillna(0, inplace=True)
year_inspection_risk
| Risk | Risk 1 (High) | Risk 2 (Medium) | Risk 3 (Low) |
|---|---|---|---|
| Year | |||
| 2010 | 11662 | 3773 | 1922 |
| 2011 | 11715 | 4018 | 1834 |
| 2012 | 11162 | 3272 | 1576 |
| 2013 | 12160 | 3622 | 1280 |
| 2014 | 13848 | 3603 | 1163 |
| 2015 | 13429 | 3451 | 1009 |
| 2016 | 15193 | 3835 | 831 |
| 2017 | 14420 | 3200 | 875 |
| 2018 | 11814 | 2264 | 770 |
| 2019 | 9746 | 1770 | 716 |
fig, ax = plt.subplots(figsize=(10,10))
year_inspection_risk.plot(kind='bar',stacked=True,figsize=(8,8),ax=ax )
plt.legend(loc="lower left", bbox_to_anchor=(1,0))
ax.set_title("The distribution of inspection risk by year",size=20)
ax.set_xlabel('Year')
ax.set_ylabel('Number')
Text(0, 0.5, 'Number')
fig, ax = plt.subplots(figsize=(10,10))
sns.scatterplot(x='Longitude', y='Latitude', hue='Risk' , data=food, ax=ax, palette = ["blue","red","green"])
ax.set_title("The distribution of inspections by risk",size=20)
ax.set_xlabel('Longitude')
ax.set_ylabel('LATITUDE')
plt.show()
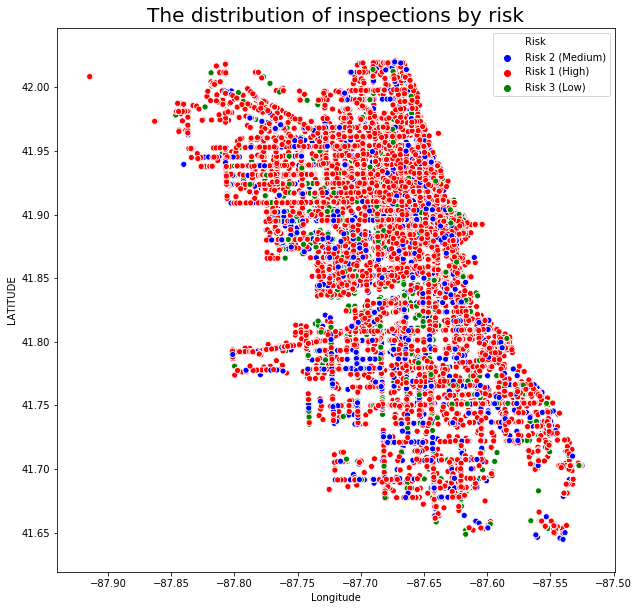
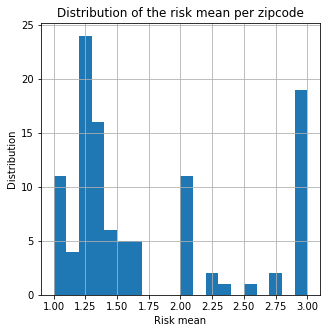
We can’t really see a general pattern let’s compute the mean risk per zipcode.
food['Risk number'] = food['Risk'].map(lambda x : int(str(x).split(' ')[1]))
mean_risk_zip = food.groupby('Zip').mean()['Risk number']
fig, ax = plt.subplots(figsize=(5,5))
mean_risk_zip.hist(bins=20)
ax.set_title("Distribution of the risk mean per zipcode")
ax.set_xlabel("Risk mean")
ax.set_ylabel("Distribution")
plt.show()
df_risk_zip = pd.DataFrame({'Zip': mean_risk_zip.index.astype(int).astype(str), 'Risk mean' :mean_risk_zip.values} )
We draw the results on the map using GeoJson zipcode file.
with open("data/Boundaries-ZIP-Codes.geojson") as json_file:
zipcodes = json.load(json_file)
m = folium.Map(location=[41.85003,-87.6], tiles='cartodbpositron', zoom_start=10.3)
folium.GeoJson(zipcodes).add_to(m)
m.save("initial_zip.html")
m
This is the map of chicago divided by zipcode
m1 = folium.Map(location=[41.85003,-87.6], tiles='cartodbpositron', zoom_start=10.3)
folium.Choropleth(
geo_data=zipcodes,
data=df_risk_zip,
columns=['Zip', 'Risk mean'],
key_on='feature.properties.zip',
fill_color='RdYlBu',
highlight=True,
fill_opacity=0.7,
legend_name="Risk Mean",
show=False,
).add_to(m1)
m1.save("zip_risk_mean.html")
m1
We now look at the proportion of fail, pass and pass wtih condition per zip code.
food.Results.value_counts()
Pass 105499
Fail 37659
Pass w/ Conditions 26775
Name: Results, dtype: int64
food.groupby('Zip').Results.count().sort_values(ascending = False)
Zip
60614.0 6167
60647.0 5922
60657.0 5713
60611.0 5623
60622.0 5327
...
60189.0 1
60477.0 1
60464.0 1
60202.0 1
60453.0 1
Name: Results, Length: 107, dtype: int64
# we group by zip and count the number of fail/pass that we normalize after
dist_zip = food.groupby('Zip').Results.value_counts().unstack().reset_index().fillna(0)
# We sum up the groups
sums = dist_zip.loc[:, ['Fail','Pass','Pass w/ Conditions']].sum(axis=1).values.reshape((-1,1))
# We normalize them
dist_zip.loc[:,['Fail','Pass','Pass w/ Conditions']]= dist_zip.loc[:,['Fail','Pass','Pass w/ Conditions']] /sums
# We count the number of samples to have an idea about the significance of our statistics
dist_zip['# of samples'] = food.groupby('Zip').Results.count().values
dist_zip.Zip = dist_zip.Zip.map(lambda x : str(int(x)) )
dist_zip.sort_values(ascending = False , by= "# of samples")
| Results | Zip | Fail | Pass | Pass w/ Conditions | # of samples |
|---|---|---|---|---|---|
| 55 | 60614 | 0.226042 | 0.568672 | 0.205286 | 6167 |
| 87 | 60647 | 0.241810 | 0.600304 | 0.157886 | 5922 |
| 95 | 60657 | 0.222825 | 0.593559 | 0.183616 | 5713 |
| 52 | 60611 | 0.165926 | 0.649475 | 0.184599 | 5623 |
| 63 | 60622 | 0.237094 | 0.615919 | 0.146987 | 5327 |
| ... | ... | ... | ... | ... | ... |
| 14 | 60148 | 0.000000 | 1.000000 | 0.000000 | 1 |
| 29 | 60438 | 0.000000 | 1.000000 | 0.000000 | 1 |
| 16 | 60155 | 0.000000 | 1.000000 | 0.000000 | 1 |
| 27 | 60423 | 0.000000 | 1.000000 | 0.000000 | 1 |
| 18 | 60189 | 0.000000 | 0.000000 | 1.000000 | 1 |
107 rows × 5 columns
dist_zip["Fail"].sort_values()
33 0.000000
21 0.000000
22 0.000000
24 0.000000
26 0.000000
...
7 0.500000
2 0.500000
41 0.666667
39 0.750000
38 0.800000
Name: Fail, Length: 107, dtype: float64
m2 = folium.Map(location=[41.85003,-87.6], tiles='cartodbpositron', zoom_start=10.3)
folium.Choropleth(
geo_data=zipcodes,
data=dist_zip,
columns=['Zip', 'Fail'],
key_on='feature.properties.zip',
fill_color='Reds',
highlight=True,
fill_opacity=0.7,
legend_name="Fail probability",
show=True,
).add_to(m2)
m2.save("zip_fail.html")
m2
m3 = folium.Map(location=[41.85003,-87.6], tiles='cartodbpositron', zoom_start=10.3)
folium.Choropleth(
geo_data=zipcodes,
data=dist_zip,
columns=['Zip', 'Pass'],
key_on='feature.properties.zip',
fill_color='RdYlGn',
highlight=True,
fill_opacity=0.7,
legend_name="Pass probability",
show=False,
).add_to(m3)
m3.save("zip_pass.html")
m3
m4 = folium.Map(location=[41.85003,-87.6], tiles='cartodbpositron', zoom_start=10.3)
folium.Choropleth(
geo_data=zipcodes,
data=dist_zip,
columns=['Zip', 'Pass w/ Conditions'],
key_on='feature.properties.zip',
fill_color='Blues',
highlight=True,
fill_opacity=0.7,
legend_name="Pass with conditions probability",
show=False,
).add_to(m4)
m4.save("zip_pass_conditions.html")
m4
Inspection type
There only is one nul value for Inspection type, we drop it
food = food[food["Inspection Type"].notnull()]
An inspection can be one of the following types:
-canvass, the mostcommon type of inspection performed at a frequency relative to the risk of the establishment;
-consultation, when the inspection is done at the request of the owner prior to the opening of the establishment;
-complaint, when the inspection is done in response to a complaint against the establishment;
-license, when the inspection is done as a requirement for the establishment to receive its license to operate;
-suspect food poisoning, when the inspection is done in response to one or more persons claiming to have gotten ill as a result of eating at the establishment (a specific type of complaint-based inspection);
-task-force inspection, when an inspection of a bar or tavern is done.
Re-inspections can occur for most types of these inspections and are indicated as such.
food["Inspection Type"].nunique()
102
We observe that we have several inspection’s types representing the same thing and thus we can regroup them.
food["Inspection Type exact"] = food["Inspection Type"].copy()
# Hardocde grouping of inspection types
def inspection_cleaning(x):
x=str(x).lower()
x=re.sub("re-","re",x)
if ('reinspection' in x ):
return 'reinspection'
elif ('sfp' in x or 'fbi' in x or 'sick' in x or 'poisoning' in x ):
x= 'food poisoning'
elif ('canvas' in x ):
x= 'canvass'
elif ('complaint' in x ):
x="complaint"
elif ('license' in x ):
x="license"
elif ('task' in x ) :
x='task force'
return x
food["Inspection Type"] = food["Inspection Type"].apply(inspection_cleaning)
food["Inspection Type"][0]
'reinspection'
Staphylococcal food poisoning (SFP) is one of the most common food-borne diseases worldwide.
The FBI or Fungus, Bacteria, and Invertebrates are decomposers.
food["Inspection Type"].nunique()
37
kept = ["canvass", "reinspection", "license", "complaint", "suspected food poisoning", "consultation", "tag removal", "recent inspection", "out of business", "task force", "food poisoning"]
food["Inspection Type"] = food["Inspection Type"].map(lambda x: x if (x in kept ) else 'other')
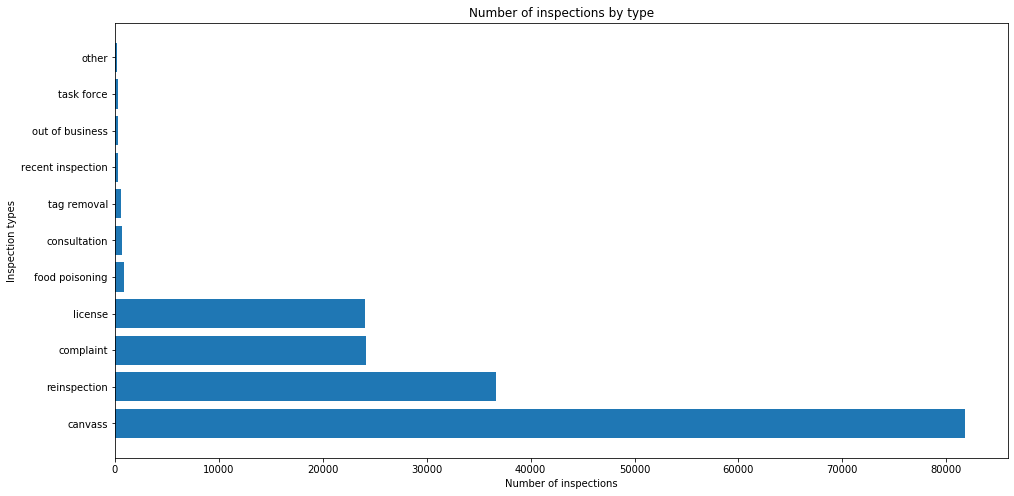
Now let’s see their distribution
inspection_count=food["Inspection Type"].value_counts()
fig ,ax=plt.subplots(figsize=(16,8))
ax.set_title("Number of inspections by type")
ax.set_xlabel("Number of inspections")
ax.set_ylabel("Inspection types")
_=ax.barh(inspection_count.index,inspection_count.values)
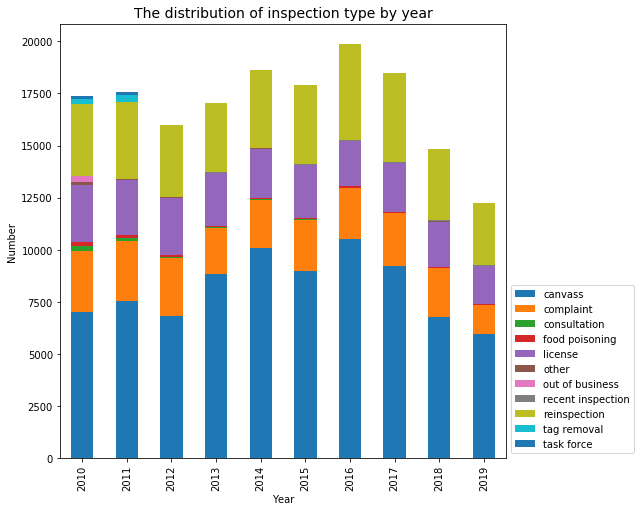
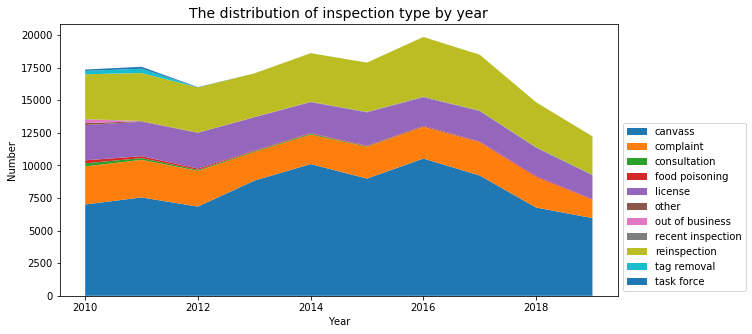
# We count the number pf inspections by type and year
year_inspection_type = pd.DataFrame(food.groupby(['Year','Inspection Type'])['Inspection ID'].count()).reset_index()
year_inspection_type = year_inspection_type.pivot(index='Year', values='Inspection ID', columns='Inspection Type')
year_inspection_type.fillna(0, inplace=True)
year_inspection_type.head()
| Inspection Type | canvass | complaint | consultation | food poisoning | license | other | out of business | recent inspection | reinspection | tag removal | task force |
|---|---|---|---|---|---|---|---|---|---|---|---|
| Year | |||||||||||
| 2010 | 7006.0 | 2920.0 | 236.0 | 233.0 | 2705.0 | 149.0 | 285.0 | 22.0 | 3437.0 | 258.0 | 106.0 |
| 2011 | 7548.0 | 2880.0 | 136.0 | 145.0 | 2642.0 | 40.0 | 1.0 | 20.0 | 3680.0 | 331.0 | 144.0 |
| 2012 | 6845.0 | 2743.0 | 74.0 | 101.0 | 2742.0 | 14.0 | 0.0 | 2.0 | 3462.0 | 6.0 | 21.0 |
| 2013 | 8834.0 | 2198.0 | 60.0 | 52.0 | 2554.0 | 4.0 | 0.0 | 12.0 | 3344.0 | 3.0 | 1.0 |
| 2014 | 10106.0 | 2261.0 | 71.0 | 44.0 | 2375.0 | 4.0 | 0.0 | 31.0 | 3720.0 | 2.0 | 0.0 |
fig, ax = plt.subplots(figsize=(10,10))
year_inspection_type.plot(kind='bar',stacked=True,figsize=(8,8),ax=ax )
plt.legend(loc="lower left", bbox_to_anchor=(1,0))
ax.set_title("The distribution of inspection type by year",size=14)
ax.set_xlabel('Year')
ax.set_ylabel('Number')
plt.show()
fig, ax = plt.subplots(figsize=(10,5))
plt.stackplot(year_inspection_type.index, year_inspection_type['canvass'], year_inspection_type['complaint'],
year_inspection_type['consultation'], year_inspection_type['food poisoning'], year_inspection_type['license'],
year_inspection_type['other'], year_inspection_type['out of business'], year_inspection_type['recent inspection'],
year_inspection_type['reinspection'], year_inspection_type['tag removal'], year_inspection_type['task force'],)
plt.legend(loc="lower left", bbox_to_anchor=(1,0),labels=year_inspection_type.columns)
ax.set_title("The distribution of inspection type by year",size=14)
ax.set_xlabel('Year')
ax.set_ylabel('Number')
plt.show()
We want to focus more on the food poisoning cases:
Food Poisoning
from ipywidgets import interact
food_poisoning_cases= food[food['Inspection Type'] == 'food poisoning']
def plot_(ticker):
fig, ax = plt.subplots(figsize=(10,10))
sns.scatterplot(x='Longitude', y='Latitude',
data=food_poisoning_cases [food_poisoning_cases["Year"]==ticker],ax=ax)
ax.set_title("The distribution of food poisoning inspection by year",size=20)
ax.set_xlabel('Longitude')
ax.set_ylabel('LATITUDE')
ax.set_ylim([41.6,42.1])
ax.set_xlim([-88,-87.5])
interact(plot_,ticker=widgets.IntSlider(min=2010,max=2019,step=1))
interactive(children=(IntSlider(value=2010, description='ticker', max=2019, min=2010), Output()), _dom_classes…
<function __main__.plot_(ticker)>
year_inspection_type['food poisoning'].plot(figsize=(10,5))
plt.title("Distribution of the food poisoning per year")
plt.xlabel("Years")
plt.ylabel("# food poisoning")
plt.show()
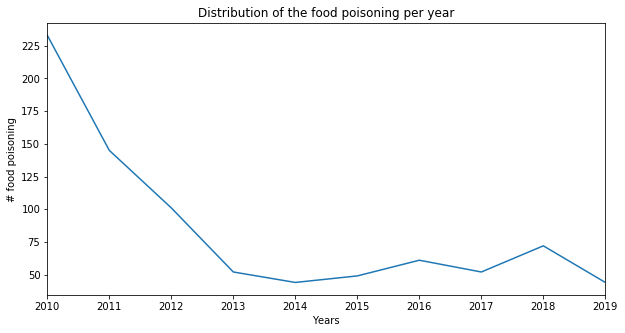
The number of inspections for food poisoning is interesting and give us some informations. Indeed, from 2010 to 2014 we observe that while the total number of food inspections increases by a factor of 1.2, there is a net decrease (by a factor of 5) of the food poisoning inspections.
So what did change, several hypohtesis are possible :
-H0: The detection algorithm improved so that from the number of inspections needed is smaller
-H1: The inspection had a direct effect and the bad restaurants were closed
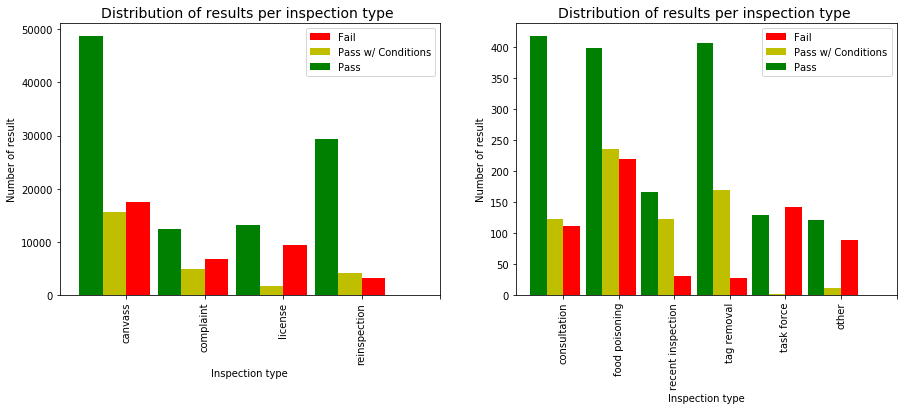
food['Fail'] = food['Results'] == "Fail"
food['Pass'] = food['Results'] == "Pass"
food['Pass w/ Conditions'] = food['Results'] == "Pass w/ Conditions"
fig = plt.figure(figsize=(15,5))
ax1 = fig.add_subplot(121)
ax2 = fig.add_subplot(122)
failures = food.groupby("Inspection Type").sum()['Fail'].copy()
successes = food.groupby("Inspection Type").sum()['Pass'].copy()
condtions = food.groupby("Inspection Type").sum()['Pass w/ Conditions'].copy()
group1 = ['canvass', 'complaint', 'license', 'reinspection','']
group2 = ['consultation' ,'food poisoning', 'recent inspection', 'tag removal', 'task force','other','']
failures[group1].plot(kind ='bar',ax=ax1, color='r',position=0,width=0.3,legend=True)
condtions[group1].plot(kind ='bar', ax=ax1, color='y',position=1,width=0.3,legend=True)
successes[group1].plot(kind ='bar', ax=ax1, color='g',position=2,width=0.3,legend=True)
ax1.set_title("Distribution of results per inspection type ",size=14)
ax1.set_xlabel('Inspection type')
ax1.set_ylabel('Number of result')
failures[group2].plot(kind ='bar',ax=ax2, color='r',position=0,width=0.3,legend=True)
condtions[group2].plot(kind ='bar', ax=ax2, color='y',position=1,width=0.3,legend=True)
successes[group2].plot(kind ='bar', ax=ax2, color='g',position=2,width=0.3,legend=True)
ax2.set_title("Distribution of results per inspection type ",size=14)
ax2.set_xlabel('Inspection type')
ax2.set_ylabel('Number of result')
plt.show()
C:\Users\hm.haitham\Anaconda3\lib\site-packages\pandas\core\series.py:1152: FutureWarning:
Passing list-likes to .loc or [] with any missing label will raise
KeyError in the future, you can use .reindex() as an alternative.
See the documentation here:
https://pandas.pydata.org/pandas-docs/stable/user_guide/indexing.html#deprecate-loc-reindex-listlike
return self.loc[key]
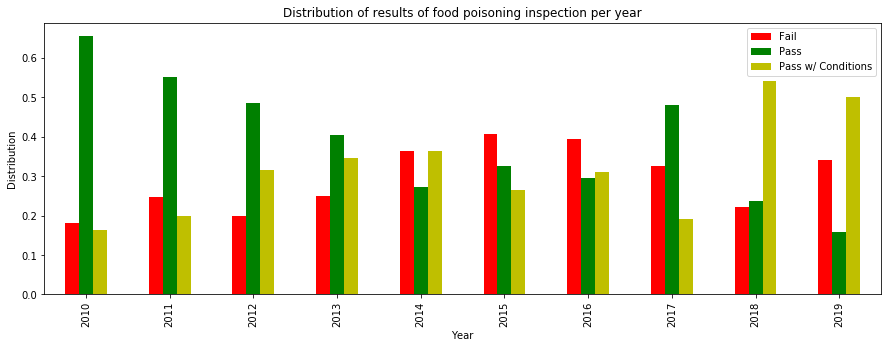
We are intersted in how food poisoning evolve through time.
food_poisoning= food[food['Inspection Type'] == 'food poisoning']
categories_food_poisonning= food_poisoning.groupby('Year').sum()[['Fail', 'Pass' , 'Pass w/ Conditions']]
total_numbers= categories_food_poisonning.sum(axis=1)
categories_food_poisonning_norm = categories_food_poisonning/total_numbers.values.reshape((-1,1))
categories_food_poisonning_norm.plot(kind='bar', color= ('r','g', 'y'), figsize = (15,5))
plt.title("Distribution of results of food poisoning inspection per year")
plt.ylabel("Distribution")
plt.show()
Adress
food["Address"]=food["Address"].str.strip()
Names
The null values in AKA Name can be replaced with their correspending BDA name
food.loc[food["AKA Name"].isnull(),"AKA Name"] = food.loc[food["AKA Name"].isnull(),"DBA Name"]
# casefold
food["DBA Name"]=food["DBA Name"].str.casefold()
food["AKA Name"]=food["AKA Name"].str.casefold()
# remove anything within paranthesis
food["AKA Name"]=food["AKA Name"].apply(lambda x: re.sub(r'\([^)]*\)', '', x ))
# Let's inspect joint businesses, these have a "/" in their AKA Name
joint=food[["/" in aka for aka in food["AKA Name"]]]["AKA Name"].unique()
joint[0:20]
array(['dunkin donuts/baskin-robbins', 'jewel / osco',
'south side fuel ctr/dunkin doughnuts',
'dunkin donuts / baskin robbins', 'catering/main kitchen',
'dunkin donuts / baskin robins', 'montessori acdy. inft/tod. cnt',
'cvs/pharmacy #2981', 'kfc/long john silver', 'mayne/act one',
'italian village / vivere', 'mayne stage/act one cafe',
'northwest middle/belmont-cragin',
'collins academy/north lawndale college prep',
'legno/suparossa carry out', 'am/pm',
'dunkin donuts / baskin robbins', 'solo cup co./aramark services',
'pink monkey / new york strip', "kmart/little caesar's"],
dtype=object)
# Lots of them are in the form "cvs/pharmacy #xxxxx" so we can fix this
cvs=food[[aka.startswith("cvs") for aka in food["AKA Name"]]]["AKA Name"].index
food.loc[cvs,"AKA Name"]="cvs"
Let’s check if we still have nan values:
null_cols=np.sum(food.isnull() , axis=0)
null_cols[null_cols>0]
Series([], dtype: int64)
<p style="text-align: center;">Analysing the Yelp Dataset</p>
<p style="text-align: center;"> </p>
</p>
1. Description of the dataset
Yelp is a business directory service and crowd-sourced review forum, it focuses on publishing crowd-sourced reviews about businesses.
To leverage useful data from the Yelp website, we use a combination of Yelp’s API - Yelp Fusion and web scraping in order to get the reviews of the restaurants in Chicago that have been labeled with “ food poisoning “ during food inspections.
a. Data collection
We started by looking into the public dataset offered by Yelp itself in https://www.yelp.com/dataset but unfortunately it didn’t contain info about businesses in Chicago. So we decided to take matters in our hands and extract our own dataset.
We started by getting all the businesses that have been labeled with “ food poisoning “ during inspections from the Chicago Food Inspection dataset, from that list of businesses we requested the Yelp API Match Endpoint with the name of each business and its address to get the unique Yelp alias of the business. In Yelp every business has both a unique ID, such as 4kMBvIEWPxWkWKFN__8SxQ, as well as a unique alias, such as yelp-san-francisco. Generally, business ID and business alias are interchangeable methods of identifying a Yelp Business. The business alias is more human-readable, but often longer, than the business ID.
From that previously obtained alias, we query the website for https://www.yelp.com/biz/alias to obtain all the reviews of a restaurant. That step is costly in terms of time spent since it is easy to get blacklisted from yelp’s website. We use different proxies and user agents to gather our data from the website.
The dataset shown here is just a sample of the entire dataset that we will submit for the next milestone, getting all the reviews we want takes time so for now we will do our analysis on 4130 reviews from 123 restaurants that are affected by food poisoning.
We also analyze the dataset containing said restaurants and information about those according to yelp.
b. Data description
Here is a brief description in each column of the restaurants dataset :
| Name | Type | Description |
|---|---|---|
| Address | String | Address of the establishment according to our food inspection dataset |
| Lincense # | int | License number of the establishment according to food inspection dataset |
| Name | String | Name of the establishment |
| alias | String | Unique Yelp alias of this business. |
| id | String | Unique Yelp id of this business |
| is_closed | bool | Wether the business has been (permanently) closed |
| overall_rating | float | Rating for this business (value ranges from 1, 1.5, … 4.5, 5). |
| price | string | Price level of the business. Value is one of $ , $$, $$$, $$$$ |
| review_count | int | Number of reviews for this business. |
The columns for the review dataset is pretty self explanatory, it contains the body of the review, the author of the review, the date for when the review was issued, the rating of the restaurant and a unique identifier for the restaurant ( alias ).
2. Loading the data
# all useful imports
import numpy as np
import pandas as pd
import matplotlib.pyplot as plt
import seaborn as sns
from wordcloud import WordCloud, STOPWORDS # this module is for making wordcloud in python
import re # regular expression
import string # for finding punctuation in text
import nltk # preprocessing text
from collections import Counter
from textblob import TextBlob
#Import dataset from previously obtained CSV file
restaurants_food_poisoning_reviews = pd.read_csv("data/sample_food_poisoning.csv",index_col=0).drop_duplicates()
restaurants_food_poisoning_reviews.head()
| reviewRating | datePublished | description | author | alias | |
|---|---|---|---|---|---|
| 0 | {'ratingValue': 1} | 2019-09-06 | Grabbed a takeout order tonight on a Friday, p... | Paul S. | picante-taqueria-chicago-2 |
| 1 | {'ratingValue': 1} | 2019-08-13 | I almost passed out eating here when I found a... | Mariam R. | picante-taqueria-chicago-2 |
| 2 | {'ratingValue': 1} | 2019-07-28 | First time we ever have gone to Picante and wa... | Maria Guadalupe V. | picante-taqueria-chicago-2 |
| 3 | {'ratingValue': 1} | 2019-05-31 | Bland. Customer service needs work. Offensive ... | Dana H. | picante-taqueria-chicago-2 |
| 4 | {'ratingValue': 1} | 2019-04-22 | Steak burrito ruined my day, stay away! Not t... | Daniel C. | picante-taqueria-chicago-2 |
#Shape of the dataset
restaurants_food_poisoning_reviews.shape
(4130, 5)
# Importing second dataset including info about the restaurants without the reviews
restaurants_food_poisoning = pd.read_csv("data/restaurant_aliases_food_poisoning_withrating.csv",index_col=0).drop_duplicates()
restaurants_food_poisoning.head()
| Address | License # | Name | alias | id | is_closed | overall_rating | price | review_count | |
|---|---|---|---|---|---|---|---|---|---|
| 0 | 2018 W DIVISION ST | 2042823.0 | picante taqueria | picante-taqueria-chicago-2 | EMj-Ke8PAxA0ppWbcsirAg | 0.0 | 3.5 | $ | 336.0 |
| 1 | 2032-2036 W Devon AVE | 2423912.0 | ghareeb nawaz restaurant | ghareeb-nawaz-chicago | sYzkzjM2upp2vW32vPaJ9w | 0.0 | 4.0 | $ | 807.0 |
| 2 | 7723 S STATE ST | 2583156.0 | jerk taco man | jerk-taco-man-chicago-5 | aInJI0-1j0L1f5BvVgoE4g | 0.0 | 2.5 | NaN | 47.0 |
| 3 | 1676 W OGDEN AVE | 2534801.0 | taqueria el rey del taco fashion 1676 inc | su-taqueria-el-rey-del-taco-chicago-5 | CeoR8-qNyXf5Rw--IUP3yg | 0.0 | 4.5 | NaN | 20.0 |
| 4 | 4337 N LINCOLN AVE | 45189.0 | the northman | the-northman-chicago-2 | XWbMHh7WQRu7tEZzIRKEgg | 0.0 | 4.5 | $$ | 235.0 |
#Shape of the dataset
restaurants_food_poisoning.shape
(94, 9)
2. Cleaning the data
# Extract rating from reviewRating then change the type of the column to int
restaurants_food_poisoning_reviews["reviewRating"]=restaurants_food_poisoning_reviews["reviewRating"].str.extract('(\d+)')
restaurants_food_poisoning_reviews = restaurants_food_poisoning_reviews.astype({'reviewRating': 'int32'})
restaurants_food_poisoning_reviews.head()
| reviewRating | datePublished | description | author | alias | |
|---|---|---|---|---|---|
| 0 | 1 | 2019-09-06 | Grabbed a takeout order tonight on a Friday, p... | Paul S. | picante-taqueria-chicago-2 |
| 1 | 1 | 2019-08-13 | I almost passed out eating here when I found a... | Mariam R. | picante-taqueria-chicago-2 |
| 2 | 1 | 2019-07-28 | First time we ever have gone to Picante and wa... | Maria Guadalupe V. | picante-taqueria-chicago-2 |
| 3 | 1 | 2019-05-31 | Bland. Customer service needs work. Offensive ... | Dana H. | picante-taqueria-chicago-2 |
| 4 | 1 | 2019-04-22 | Steak burrito ruined my day, stay away! Not t... | Daniel C. | picante-taqueria-chicago-2 |
restaurants_food_poisoning_reviews.dtypes
reviewRating int32
datePublished object
description object
author object
alias object
dtype: object
# We check for null values in columns
restaurants_food_poisoning_reviews.columns[restaurants_food_poisoning_reviews.isnull().any()].tolist()
[]
# We check for empty strings
restaurants_food_poisoning_reviews.columns[(restaurants_food_poisoning_reviews=='').any()].tolist()
[]
# now to the restaurants info dataset
restaurants_food_poisoning.dtypes
Address object
License # float64
Name object
alias object
id object
is_closed float64
overall_rating float64
price object
review_count float64
dtype: object
# We check for null values in columns
restaurants_food_poisoning.columns[restaurants_food_poisoning.isnull().any()].tolist()
['price']
# To deal with the missing values in price we later plot a distribution over the price variable and then decide what do we set it
# We check for empty strings
restaurants_food_poisoning.columns[(restaurants_food_poisoning=='').any()].tolist()
[]
# The id column was only useful for the yelp part, aliases are already a unique identifier and easier to read so we get rid of it
restaurants_food_poisoning = restaurants_food_poisoning.drop(['id'],axis = 1)
# replace dollar sign to get data that can be parsed because dollar signs cause problems in strings
restaurants_food_poisoning = restaurants_food_poisoning.astype({'price': 'str'})
restaurants_food_poisoning['price'] = restaurants_food_poisoning['price'].str.replace('$', '\$')
3. Understanding what’s in the data
a. Distributions
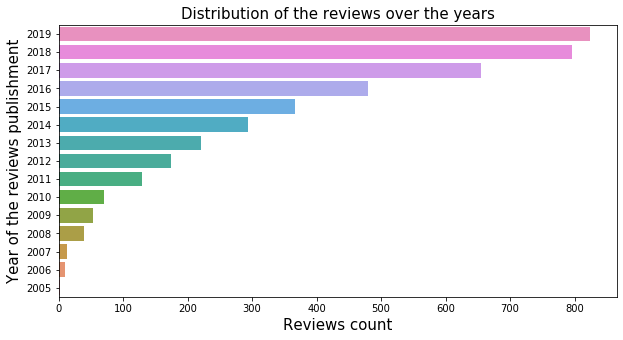
# We get the distribution of reviews over the years
restaurants_food_poisoning_reviews['year_of_review'] = restaurants_food_poisoning_reviews.datePublished.map(lambda x : int(x[:4]))
# Plotting the distribution of the reviews over the years
plt.figure(figsize=(10, 5))
p = sns.countplot(data = restaurants_food_poisoning_reviews, y = 'year_of_review', orient="h").invert_yaxis()
plt.title("Distribution of the reviews over the years",fontsize=15)
plt.xlabel('Reviews count',fontsize=15)
plt.ylabel('Year of the reviews publishment',fontsize=15);
# We analyse bad ratings of reviews by getting the restaurants with most bad rating scores. As we work on a sample
# of the data, reviews counts may be lower for some restaurants.
ratings = restaurants_food_poisoning_reviews[restaurants_food_poisoning_reviews.reviewRating == 1].groupby(['alias', 'reviewRating']).agg('size').to_frame('count').reset_index().sort_values(by='count', ascending=False)
ratings[:20]
| alias | reviewRating | count | |
|---|---|---|---|
| 40 | fremont-chicago | 1 | 40 |
| 12 | bbq-supply-chicago-3 | 1 | 40 |
| 55 | lao-sze-chuan-uptown-chicago | 1 | 40 |
| 88 | river-roast-chicago-3 | 1 | 40 |
| 34 | dolo-restaurant-and-bar-chicago-3 | 1 | 40 |
| 35 | duseks-board-and-beer-chicago-2 | 1 | 40 |
| 18 | borinquen-restaurant-chicago-3 | 1 | 40 |
| 94 | sonic-drive-in-chicago | 1 | 40 |
| 15 | blaze-n-grill-chicago | 1 | 40 |
| 84 | picante-taqueria-chicago-2 | 1 | 40 |
| 25 | chengdu-impression-chicago | 1 | 40 |
| 43 | ghareeb-nawaz-chicago | 1 | 40 |
| 65 | marianos-fresh-market-chicago-10 | 1 | 40 |
| 8 | american-junkie-chicago | 1 | 40 |
| 64 | marianos-chicago-3 | 1 | 40 |
| 49 | ja-grill-hyde-park-chicago | 1 | 40 |
| 63 | marianos-chicago-13 | 1 | 40 |
| 106 | the-halal-guys-chicago | 1 | 40 |
| 62 | margaritaville-chicago-chicago | 1 | 40 |
| 48 | italian-express-chicago | 1 | 32 |
plt.figure(figsize=(10, 5))
#p = sns.barplot(x ='alias', y = 'count', data = ratings[:10], orient="h").invert_yaxis();
p = sns.barplot(data = ratings[:20], x='count', y = 'alias', orient="h")
plt.title("Names of business with the most One Star Reviews",fontsize=15)
plt.xlabel('count of One Star reviews',fontsize=15)
plt.ylabel('Alias of restaurant',fontsize=15);
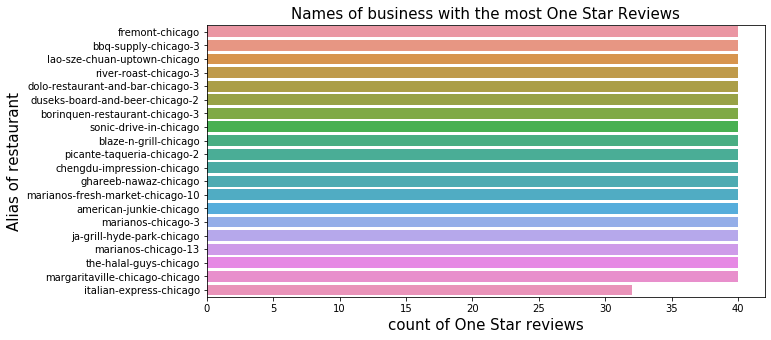
This plot shows the names of business from the Yelp reviews sample with the most One Star Reviews. Since we are handling a sample, we unfortunately didn’t get a clearer ranking in terms of number of One Star Reviews since the number of reviews we have so far is limited. This plot would be more significant when we will work with the entire dataset.
# Now for the restaurants info dataset
# Since the price column contains dollars, we are going to change dollar signs to integers
restaurants_food_poisoning['price'].unique()
array(['$', nan, '$$', '$$$', '$$$$'], dtype=object)
# Plotting the distribution of the price range by business
dat = restaurants_food_poisoning.groupby(['price']).agg('size').to_frame('count').reset_index()
ax = sns.barplot(x="price",y="count", data=dat)
plt.title("Distribution of the price range by business",fontsize=15)
plt.xlabel('Price range',fontsize=15)
plt.ylabel('Businesses_count',fontsize=15);
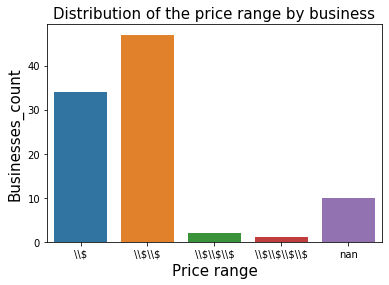
Here we can see from our sample that the data is right skewed , the restaurants that fail food inspections for food poisoning are more likely to be cheap
# We replace the nans of the price range with the most reprensented value $$
# this can change when we get the whole dataset
restaurants_food_poisoning['price'] = restaurants_food_poisoning['price'].replace('nan', '\$\$', regex=True)
# Plotting the distribution of the overall_ratings by business
dat = restaurants_food_poisoning.groupby(['overall_rating']).agg('size').to_frame('count').reset_index()
ax = sns.barplot(x="overall_rating",y="count", data=dat)
plt.title("Distribution of the overall ratings by business",fontsize=15)
plt.xlabel('Overall ratings',fontsize=15)
plt.ylabel('Businesses_count',fontsize=15);
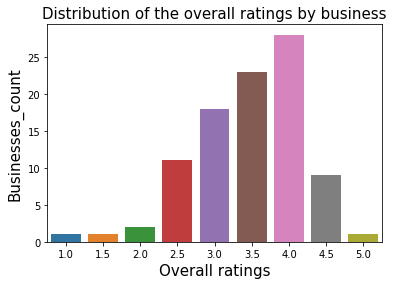
We can see here that the ratings are left skewed, so restaurants still have good grades despite having had food poisoning
# Plotting the distribution of the overall_ratings by business
dat = restaurants_food_poisoning.groupby(['is_closed']).agg('size').to_frame('count').reset_index()
ax = sns.barplot(x="is_closed",y="count", data=dat)
plt.title("Distribution of the permanently closed businesses",fontsize=15)
plt.xlabel('is_closed ',fontsize=15)
plt.ylabel('Businesses_count',fontsize=15);
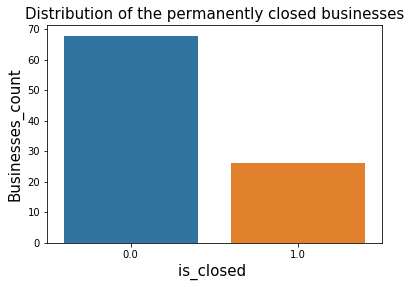
Here 0 means that the restaurant is currently opened and 1 means that the restaurant is permanently closed, we can clearly see from this sample that the restaurants that faced food inspections and failed for food poisoning have a high chance of being closed permanently today
# Plotting the distribution of the overall number of reviews by business
plt.figure(figsize=(4, 8))
sns.boxplot(restaurants_food_poisoning.review_count,
orient='v', color='#F6A6A0')
plt.ylabel('Number of reviews per busniness')
plt.title("Distribution of the overall number of reviews per business");
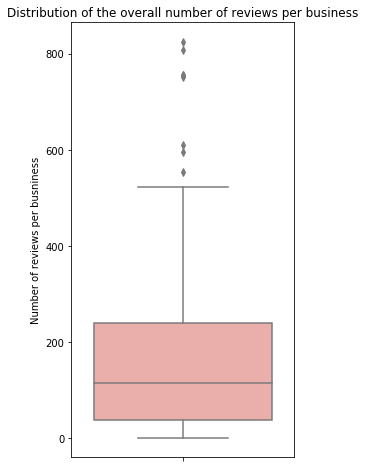
Here we see that most of the restaurants have between 50 and 200 reviews
# We plot the top 10 businesses by number of overall reviews
restaurants_food_poisoning.sort_values(by='review_count', ascending=False)
---------------------------------------------------------------------------
NameError Traceback (most recent call last)
<ipython-input-1-d4d92bb30ce6> in <module>
1 # We plot the top 10 businesses by number of overall reviews
----> 2 restaurants_food_poisoning.sort_values(by='review_count', ascending=False)
NameError: name 'restaurants_food_poisoning' is not defined
b. Correlations
# Correlation between variables in the restaurants dataset
restaurants_food_poisoning[['is_closed','overall_rating','review_count']].corr()
| is_closed | overall_rating | review_count | |
|---|---|---|---|
| is_closed | 1.000000 | -0.221065 | -0.027791 |
| overall_rating | -0.221065 | 1.000000 | 0.375824 |
| review_count | -0.027791 | 0.375824 | 1.000000 |
# Plotting the heatmap.
plt.figure(figsize=(5,5))
ax = sns.heatmap(restaurants_food_poisoning[['is_closed','overall_rating','review_count']].corr(), annot=True, fmt=".2f", cmap = "coolwarm")
# This is a small fix to have the heatmap not be cropped on the top and bottom parts.
bottom, top = ax.get_ylim()
ax.set_ylim(bottom + 0.5, top - 0.5)
ax.set_title('Heatmap of the correlation between variables in the restaurants dataset.')
ax;
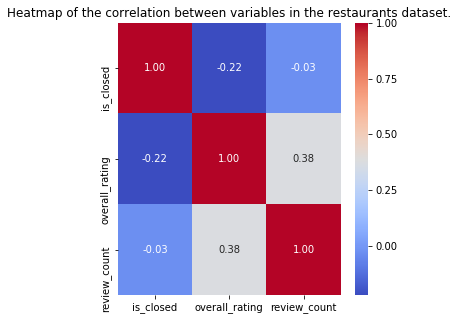
Here we see that the correlation between variables stays relatively low, even though we can see that the higher the review_count is the higher the overall_rating for that restaurant is which makes sense since popular restaurants normally are popular for a “reason” so they may serve at least decent food. We also see that the restaurant that the fact that a restaurant has bad overall rating affects if a restaurant is closed or not.
4. Enriching, filtering, transforming the data according to your needs.
a. Enriching the data
- Detecting the language of reviews
# We detect the language of the reviews for the coming text analysis
from langdetect import detect
restaurants_food_poisoning_reviews["language"] = restaurants_food_poisoning_reviews.description.map(lambda x: detect(x))
# We see that there are to languages, English and Spanish, we delve further to see what comments were actually said in spanish
restaurants_food_poisoning_reviews["language"].unique()
array(['en', 'es'], dtype=object)
restaurants_food_poisoning_reviews[restaurants_food_poisoning_reviews["language"] == 'es']['description'].iloc[0]
"Yesterday I went to eat here and the food is excellent I like it but it is unfortunate that they have a manager named CORNELIUS who is racist, I do not let myself eat in the place and I call the police, maybe I have a complex with Hispanics but I do not blamed the place, maybe they don't even know the serious problems CORNELIUS has inside\n\nayer fui a comer aqui y la comida es excelente me gusta pero es lamentable que tengan un manager de nombre CORNELIUS que es racista, no me dejo comer en el lugar y me llamo a la policia, quiza tenga algun complejo con los hispanos pero no le hecho la culpa al local, quiza no saben aun los graves problemas que tiene CORNELIUS en su interior"
# We see that we only have one review in spanish for this sample, thus we just choose to ignore it for now when we do further text processing
# For the next milestone, when we have complete data, if we see that the numbear of reviews in languages other than english is significant
# we will treat them accordingly, by doing a specific preprocessing to each language according to their respective stopwords and
# study the relationship between words in all languages.
# For now we focus on the english language since it is difficult to leverage useful data from only one review
restaurants_food_poisoining = restaurants_food_poisoning_reviews[restaurants_food_poisoning_reviews["language"] == 'en']
b. Transforming the text in reviews to remove noise
# Introduce a preprocessing function to get rid of stopwords in the description of reviews
def preprocess(x):
x = re.sub('[^a-z\s]', '', x.lower()) # get rid of noise
x = [w for w in x.split() if w not in set(stopwords)] # remove stopwords
return ' '.join(x) # then join the text again
#Constructing a list of stopwords
#download all stopwords from the nltk library
nltk.download('stopwords')
#get a list of all english stopwords
i = nltk.corpus.stopwords.words('english')
#get a list of all punctuations
j = list(string.punctuation)
stopwords = set(i).union(j)
[nltk_data] Downloading package stopwords to
[nltk_data] C:\Users\KaabachiBayrem\AppData\Roaming\nltk_data...
[nltk_data] Package stopwords is already up-to-date!
# filter the column description according to the stopwords
restaurants_food_poisoning_reviews["description_filtered"]= restaurants_food_poisoning_reviews.apply(lambda row : preprocess(row["description"]) , axis = 1)
restaurants_food_poisoning
| reviewRating | datePublished | description | author | alias | year_of_review | language | description_filtered | |
|---|---|---|---|---|---|---|---|---|
| 0 | 1 | 2019-09-06 | Grabbed a takeout order tonight on a Friday, p... | Paul S. | picante-taqueria-chicago-2 | 2019 | en | grabbed takeout order tonight friday place dea... |
| 1 | 1 | 2019-08-13 | I almost passed out eating here when I found a... | Mariam R. | picante-taqueria-chicago-2 | 2019 | en | almost passed eating found bug inside steak ta... |
| 2 | 1 | 2019-07-28 | First time we ever have gone to Picante and wa... | Maria Guadalupe V. | picante-taqueria-chicago-2 | 2019 | en | first time ever gone picante disappointed mind... |
| 3 | 1 | 2019-05-31 | Bland. Customer service needs work. Offensive ... | Dana H. | picante-taqueria-chicago-2 | 2019 | en | bland customer service needs work offensive pa... |
| 4 | 1 | 2019-04-22 | Steak burrito ruined my day, stay away! Not t... | Daniel C. | picante-taqueria-chicago-2 | 2019 | en | steak burrito ruined day stay away worst food ... |
| ... | ... | ... | ... | ... | ... | ... | ... | ... |
| 455 | 2 | 2015-07-29 | Service and quality of the food has definitel... | tracy h. | borinquen-lounge-chicago | 2015 | en | service quality food definitely gone used one ... |
| 456 | 2 | 2015-01-28 | Mediocre at best. Had a soup, included bones..... | Jon W. | borinquen-lounge-chicago | 2015 | en | mediocre best soup included bones broth bland ... |
| 457 | 2 | 2014-06-30 | A bit disappointing, I used to love this plac... | Elsi G. | borinquen-lounge-chicago | 2014 | en | bit disappointing used love place finally deci... |
| 458 | 2 | 2014-06-28 | The 2 starts are for the service but the food ... | Linda A. | borinquen-lounge-chicago | 2014 | en | starts service food good jibarito cooked super... |
| 459 | 2 | 2013-10-13 | I guess sometimes, yelp gets it wrong. This pl... | Nathaniel C. | borinquen-lounge-chicago | 2013 | en | guess sometimes yelp gets wrong place subpar f... |
4130 rows × 8 columns
4. Deep dive analysis of two businesses that failed food inspections for food poisoning
a. BBQ Supply Co restaurant
# Get all the reviews of BBQ Supply CO restaurant
bbq_reviews = restaurants_food_poisoning_reviews[restaurants_food_poisoning_reviews.alias == 'bbq-supply-chicago-3']
bbq_reviews.head()
| reviewRating | datePublished | description | author | alias | year_of_review | language | description_filtered | |
|---|---|---|---|---|---|---|---|---|
| 1575 | 1 | 2019-09-30 | I asked for some extra chips and the guy bring... | JP H. | bbq-supply-chicago-3 | 2019 | en | asked extra chips guy bringing back eating lol... |
| 1576 | 1 | 2018-04-29 | Tried to order from here. They cancelled my or... | Kim M. | bbq-supply-chicago-3 | 2018 | en | tried order cancelled order store reason calle... |
| 1577 | 1 | 2017-12-12 | I was hoping to like this place and had a stro... | Tashia A. | bbq-supply-chicago-3 | 2017 | en | hoping like place strong craving bbq days seve... |
| 1578 | 1 | 2017-10-21 | Well I really had high hopes for this place. ... | Joshua W. | bbq-supply-chicago-3 | 2017 | en | well really high hopes place could give zero s... |
| 1579 | 1 | 2017-10-13 | Everything was way too smoky...chips...everyth... | Gina L. | bbq-supply-chicago-3 | 2017 | en | everything way smokychipseverything absolutely... |
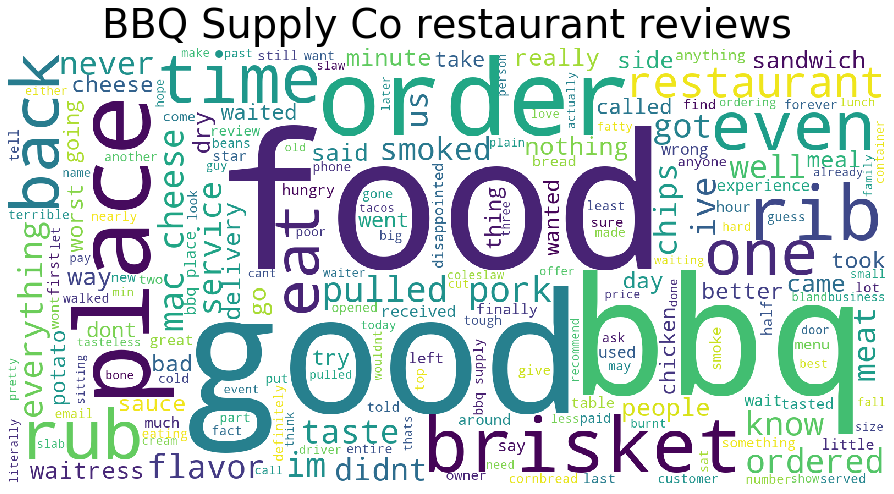
We make a word cloud of BBQ Supply Co restaurant reviews to have an idea about most used words over the reviews
wc = WordCloud(background_color="white",width=1600, height=800, random_state=1, max_words=200)
# Join all strings together from the filtered description column to obtain all review text for the restaurant
wc.generate(' '.join(bbq_reviews['description_filtered']))
plt.figure(figsize=(15,10))
# Add title to figure
plt.title("BBQ Supply Co restaurant reviews", fontsize=40)
plt.imshow(wc)
plt.axis('off')
plt.tight_layout(pad=10)
# We get the 20 most occuring words over the reviews.
# Pass the split_it list to instance of Counter class.
splitted = bbq_reviews['description_filtered'].apply(lambda x: x.split()).to_list()
flatten = [item for sublist in splitted for item in sublist]
counter = Counter(flatten)
# most_common() produces k frequently encountered
# input values and their respective counts.
most_occur = counter.most_common(20)
most_occur
[('bbq', 40),
('food', 36),
('place', 32),
('good', 28),
('like', 28),
('order', 23),
('cheese', 23),
('brisket', 22),
('pulled', 19),
('even', 18),
('pork', 17),
('ribs', 17),
('back', 16),
('mac', 16),
('chips', 15),
('one', 15),
('time', 15),
('eat', 14),
('would', 14),
('ive', 14)]
Conclusion ==>
When inspecting the word cloud, we can see some negative words like bad, wrong and disappointed. The 20 most occuring words show us no sign of negative reviews nor food poisoning.
In order to have a sharper view on bad reviews, we make a sentiment analysis over reviews.
Sentiment analysis is the process of computationally identifying and categorizing opinions expressed in a text. Especially we apply this process on our reviews in order to determine whether the writer’s attitude towards a restaurant’s service is positive, negative, or neutral.
#Now we add a column which has the sentiment values of the each review posted for BBQ Supply Co, to see how the
#author of this review feels about the restaurant.
#Create Text Blob Object and draw out the sentiment of each review by returning a value between -1.0 (extreme negative)
#and 1.0 (extreme positive).
bbq_reviews['sentiment_analysis'] = bbq_reviews['description_filtered'].apply(lambda x: TextBlob(x).sentiment.polarity)
bbq_reviews = bbq_reviews.sort_values(by='sentiment_analysis', ascending=True)
bbq_reviews[:10]
C:\Users\KaabachiBayrem\.conda\envs\ada\lib\site-packages\ipykernel_launcher.py:6: SettingWithCopyWarning:
A value is trying to be set on a copy of a slice from a DataFrame.
Try using .loc[row_indexer,col_indexer] = value instead
See the caveats in the documentation: http://pandas.pydata.org/pandas-docs/stable/user_guide/indexing.html#returning-a-view-versus-a-copy
| reviewRating | datePublished | description | author | alias | year_of_review | language | description_filtered | sentiment_analysis | |
|---|---|---|---|---|---|---|---|---|---|
| 1601 | 1 | 2015-02-20 | I just received delivery of a pulled pork sand... | k h. | bbq-supply-chicago-3 | 2015 | en | received delivery pulled pork sandwich mac n c... | -1.000000 |
| 1576 | 1 | 2018-04-29 | Tried to order from here. They cancelled my or... | Kim M. | bbq-supply-chicago-3 | 2018 | en | tried order cancelled order store reason calle... | -0.800000 |
| 1594 | 1 | 2016-01-03 | Literally the worst bbq and worst service at a... | Corie Z. | bbq-supply-chicago-3 | 2016 | en | literally worst bbq worst service restaurant i... | -0.333333 |
| 1596 | 1 | 2015-06-22 | Fatty Brisket with no flavor. St. Louis cut po... | Li S. | bbq-supply-chicago-3 | 2015 | en | fatty brisket flavor st louis cut poor flavor ... | -0.194444 |
| 1612 | 1 | 2013-06-06 | Worst BBQ I've ever had. For a barbecue joint... | Paco R. | bbq-supply-chicago-3 | 2013 | en | worst bbq ive ever barbecue joint st louis sty... | -0.172153 |
| 1593 | 1 | 2016-04-29 | Smelled delish when we walked in the door. But... | Nancy T. | bbq-supply-chicago-3 | 2016 | en | smelled delish walked door went hill sat back ... | -0.171429 |
| 1591 | 1 | 2016-06-01 | My brother and I came here last month and it w... | Charisse B. | bbq-supply-chicago-3 | 2016 | en | brother came last month extremely disappointin... | -0.161966 |
| 1603 | 1 | 2014-12-19 | The stale vinegar odor got me first, before I ... | Barbara N. | bbq-supply-chicago-3 | 2014 | en | stale vinegar odor got first even opened styro... | -0.090833 |
| 1585 | 1 | 2017-04-06 | I'll give BBQ Supply at least one star since I... | Nigel P. C. | bbq-supply-chicago-3 | 2017 | en | ill give bbq supply least one star since cant ... | -0.074306 |
| 1588 | 1 | 2017-03-31 | I used to love this place when it was Rubs, at... | Holly T. | bbq-supply-chicago-3 | 2017 | en | used love place rubs ate many times took cooki... | -0.068366 |
Here is the first top 5 most negative reviews to BBQ Supply Co restaurant :
o I just received delivery of a pulled pork sandwich and Mac 'n' cheese ... One minute after eating it I promptly vomited. All I could taste was liquid smoke. I threw the rest of my lunch. Disgusting.
o Tried to order from here. They cancelled my order in store for no reason. I called and they said they could re-take it but the money I paid for with my card is already gone, waiting 3-5 business days for a refund, that's stupid.
o Literally the worst bbq and worst service at a restaurant I\'ve ever had. Let me start by saying I love smoked bbq. I\'ve eaten at dozens of bbq restaurants over the country and have smoked my own meat as well. I\'m no expert at bbq but I definitely enjoying eating it. However, the food here tasted like cigarette smoke - not bbq smoke. I couldn\'t swallow or even stand the smell of this ashtray food. The worst part of the whole experience is that when I complained to the server about the food she said "there\'s nothing wrong with that food". I told her it\'s awful and won\'t eat it. She said I didn\'t have to eat it but I would still have to pay for it. After arguing with the manager on duty, they refused to change my bill or offer me something else to eat. I reluctantly paid the bill for food I didn\'t eat (left it on the table with only about 4 bites taken) and walked out hungry. I\'ve never experienced such ignorance from a business. Definitely will not return.
o Fatty Brisket with no flavor. St. Louis cut poor flavor. What do they have against salt. Over priced, over rated and typical White folks BBQ. If Bubba ain't on the pit or seasoning the meat then Bye. If anyone in the Kitchen have no roots past Virginia then say hello to average mac, corn bread and any thing else that goes well with BBQ. Another rip off
o Worst BBQ I've ever had. For a barbecue joint having only St. Louis Style Ribs is a major oversight. Baby Backs should at least be an option. I could even forgive the lack of Baby Back Ribs option if the overpriced St. Louis Style Ribs were actually good but they aren't. I ordered a full slab and was met with ribs that were tasteless and tough as tire rubber. Bread on the side, which in all other rib shacks equals a slice of white bread, consisted of a sandwich bun. Seriously?! Don't look for Fries or anything else needing a deep fryer on the menu either because they lack a deep fryer. My wife was disappointed in her dry pulled pork sandwich as well. The BBQ sauces were locked tighter than Fort Knox in their containers and nearly impossible to extricate. Presentation was poor as well. The full slab was cut up into individual ribs and placed into a paper holding tray. No where on the metal tray was there anywhere to discard the rib bones. They teach cooking classes at Rub as well which shouldn't be allowed considering the quality of their food. Overall, a very poor example of BBQ. I suggest Hecky's, Uncle Willy's, or Uncle John's if you want quality ribs in Chicago.
When reading the first review with -1 sentiment value, we detect a food poisoning sign: ‘One minute after eating it I promptly vomited. All I could taste was liquid smoke’.
b. Margaritaville restaurant
# Get all the reviews of BBQ Supply CO restaurant
margaritaville_reviews = restaurants_food_poisoning_reviews[restaurants_food_poisoning_reviews.alias == 'margaritaville-chicago-chicago']
margaritaville_reviews.head()
| reviewRating | datePublished | description | author | alias | year_of_review | language | description_filtered | |
|---|---|---|---|---|---|---|---|---|
| 420 | 1 | 2019-11-08 | The people who work here do not want customers... | Ann F. | margaritaville-chicago-chicago | 2019 | en | people work want customers sign read gone fish... |
| 421 | 1 | 2019-11-08 | Wow! Just walked in. Not busy at all! Total... | Michelle F. | margaritaville-chicago-chicago | 2019 | en | wow walked busy totally ignored walked saw ple... |
| 422 | 1 | 2019-11-08 | We had 2 small grandchildren with us, asked wh... | Judy K. | margaritaville-chicago-chicago | 2019 | en | small grandchildren us asked kids menus waitre... |
| 423 | 1 | 2019-10-23 | We waited for some time and the waitress came ... | Thomas L. | margaritaville-chicago-chicago | 2019 | en | waited time waitress came said would serve us ... |
| 424 | 1 | 2019-09-28 | So I sent an email out about my horrible exper... | Jacqueline R. | margaritaville-chicago-chicago | 2019 | en | sent email horrible experience lady first seem... |
wc = WordCloud(background_color="white",width=1600, height=800, random_state=1, max_words=200)
# Join all strings together from the filtered description column to obtain all review text for the restaurant
wc.generate(' '.join(margaritaville_reviews['description_filtered']))
plt.figure(figsize=(15,10))
# Add title to figure
plt.title("Margaritaville restaurant reviews", fontsize=40)
plt.imshow(wc)
plt.axis('off')
plt.tight_layout(pad=10)
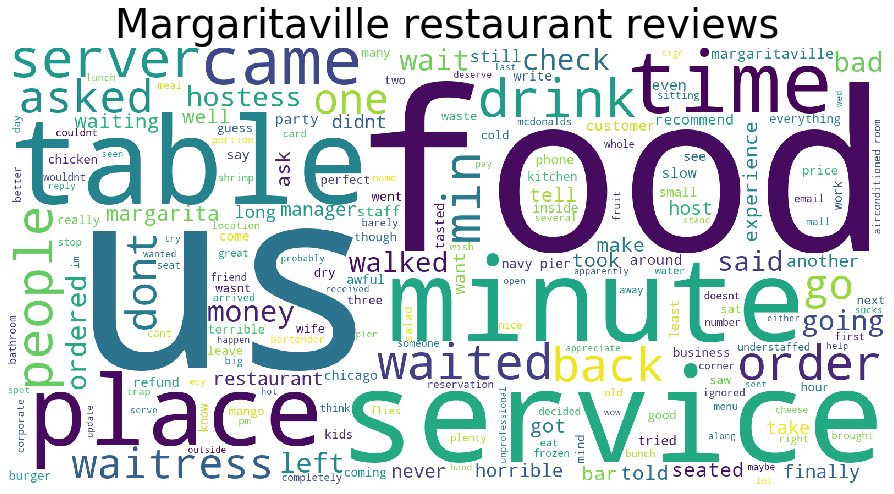
# We get the 20 most occuring words over the reviews.
# Pass the split_it list to instance of Counter class.
splitted = margaritaville_reviews['description_filtered'].apply(lambda x: x.split()).to_list()
flatten = [item for sublist in splitted for item in sublist]
counter = Counter(flatten)
# most_common() produces k frequently encountered
# input values and their respective counts.
most_occur = counter.most_common(20)
most_occur
[('us', 35),
('food', 33),
('service', 22),
('would', 20),
('minutes', 19),
('place', 17),
('came', 17),
('like', 15),
('people', 14),
('time', 14),
('server', 14),
('table', 13),
('waited', 13),
('back', 12),
('asked', 11),
('waitress', 11),
('go', 11),
('one', 11),
('dont', 11),
('min', 11)]
When inspecting the word cloud, we can see some negative words like bad, awful and slow. The 20 most occuring words show us no sign of negative reviews nor food poisoning.
In order to have a sharper view on bad reviews, we make a sentiment analysis over reviews.
#Now we add a column which has the sentiment values of the each review posted for Margaritaville, to see how the
#author of this review feels about the restaurant.
#Create Text Blob Object and draw out the sentiment of each review by returning a value between -1.0 (extreme negative)
#and 1.0 (extreme positive).
margaritaville_reviews['sentiment_analysis'] = margaritaville_reviews['description_filtered'].apply(lambda x: TextBlob(x).sentiment.polarity)
margaritaville_reviews = margaritaville_reviews.sort_values(by='sentiment_analysis', ascending=True)
margaritaville_reviews[:10]
C:\Users\KaabachiBayrem\.conda\envs\ada\lib\site-packages\ipykernel_launcher.py:6: SettingWithCopyWarning:
A value is trying to be set on a copy of a slice from a DataFrame.
Try using .loc[row_indexer,col_indexer] = value instead
See the caveats in the documentation: http://pandas.pydata.org/pandas-docs/stable/user_guide/indexing.html#returning-a-view-versus-a-copy
| reviewRating | datePublished | description | author | alias | year_of_review | language | description_filtered | sentiment_analysis | |
|---|---|---|---|---|---|---|---|---|---|
| 449 | 1 | 2018-11-06 | Had a horrible experience here. Waited a hour ... | Ryan D. | margaritaville-chicago-chicago | 2018 | en | horrible experience waited hour disgusting san... | -0.866667 |
| 432 | 1 | 2019-07-11 | Don't go here. The hostess has a terrible att... | Joey B. | margaritaville-chicago-chicago | 2019 | en | dont go hostess terrible attitude walked walke... | -0.456250 |
| 440 | 1 | 2019-05-26 | Horrible and slow service...waited over 15 min... | Nisha L. | margaritaville-chicago-chicago | 2019 | en | horrible slow servicewaited minutes waitress e... | -0.433333 |
| 435 | 1 | 2019-06-20 | Absolutely horrible service. Must have caught ... | Jeff B. | margaritaville-chicago-chicago | 2019 | en | absolutely horrible service must caught shift ... | -0.313462 |
| 447 | 1 | 2018-12-27 | The food was cold, the service was awful and w... | Carlos T. | margaritaville-chicago-chicago | 2018 | en | food cold service awful constantly ask water n... | -0.295000 |
| 423 | 1 | 2019-10-23 | We waited for some time and the waitress came ... | Thomas L. | margaritaville-chicago-chicago | 2019 | en | waited time waitress came said would serve us ... | -0.275000 |
| 445 | 1 | 2019-01-21 | Our waitress was awful. She had a passive aggr... | Katelynn B. | margaritaville-chicago-chicago | 2019 | en | waitress awful passive aggressive attitude who... | -0.237500 |
| 458 | 1 | 2018-07-07 | Their hosts were completely confused when seat... | Alyssa M. | margaritaville-chicago-chicago | 2018 | en | hosts completely confused seating us called us... | -0.213333 |
| 453 | 1 | 2018-08-17 | Overpriced garbage food! Bad service, long ser... | S D. | margaritaville-chicago-chicago | 2018 | en | overpriced garbage food bad service long servi... | -0.203750 |
| 451 | 1 | 2018-10-28 | Nice waitress. Absolutely awful food: tasteles... | jenn H. | margaritaville-chicago-chicago | 2018 | en | nice waitress absolutely awful food tasteless ... | -0.180000 |
Let’s look at those reviews and detect those related to food poisoning
o Grabbed a takeout order tonight on a Friday, place was dead and every employee was a joke. Took 20 mins for 2 veggie tacos and employees were dying laughing about how they unplugged the GrubHub device and all the GrubHub orders we’re calling the phone to get refunds and they would hang up and cuss them out. Food was subpar. 3 people working on Friday night for a place that can probably seat 50 people. Unsurprisingly they had 4 customers. Shame on me for even trying the place.
o I almost passed out eating here when I found a bug INSIDE my steak taco … the chicken tacos were really dry and bland. The steak was good but omg the fact that something was crawling inside it.
o Bland. Customer service needs work. Offensive patrons. My chips and salsa was served in a ziplock bag . A generic one…
o Steak burrito ruined my day, stay away! Not the worst food poisoning I’ve ever had but pretty bad. Wouldn’t come back ever.
o Useless. This place used to be great. Now they don’t answer their phone, their message box is full, and their employees don’t know how to operate the credit card machine. Why bother…
o I literally live right across the street and I would rather get in my car and go get tacos or not eat them at all. Way over priced for what you get and they aren’t even good. I wouldn’t even pay 1 dollar for them let alone almost 4 dollars. Insane.
o As I am sitting here disgusted by what I jut consumed. The order of nachos without meat, intentionally I did not order meat to avoid the extra heavy feeling after eating. My order consisted of a massive order of chips, black beans, salsa, shredded cheese, a corner of sour cream & sliced avocado per my request & jalapeños. Flavorless is the biggest disappointment, beans no flavor, Salsa no flavor. I would not have enjoyed this if I was hung over. I came here per recommendation from a business down the street that was servicing my car. Never again. As people were walking in to order food, I wanted to ask, “what are you eating here & what does it taste like?”. I was actually headed to The Girl & Goat Diner, but came here out of convenience. I know next time.
Conclusion :
For further work we will construct our own dictionary of words related to food poisoning, that allow us easily pinpoint reviews that may show us signs of food poisoning in a restaurant.
Informed Plan
Food Chain investigation
Are food chains in different areas more prone to food inspections failure than the same food chains in other areas ?
To answer this question, we will analyze the geoographical distribution of risk, types of inspection, inpection result and violation type. We have shown that this is possible to do as we did it for the entire data and we want to do this now for the specific case of food chains in order to conclude whether these characteristics change depending on location within the same food chain.
Chicago Tribune article
Can we assess how real Chicago Tribune’s critics are ?
To answer this question, first we will seperate the establishments by risk category and then we will observe the frequency of inspections and how the inspection’s result impact the next inspection.Secondly, we will look at whether there has been a notable change in the inspection behavior past the article publication’s date. The article asks an important question “Does Chicago need more inspectors or more realisitc rules ?”. Therefore, we will try to answer this question by comparing the impact of the frequency of the previous investigation and the previous violation assigned on the next result. For the inspections’ frequency we can see by how much the probabilty of a complaint or food poisonning investigation changes with the time interval between inspections. For the “rules” criteria we can look at the most commun reported violations in passed inspections before a business fails and assess how critical their impact is.
Food chains
food[food["DBA Name"]=="subway"]["AKA Name"].unique()
array(['subway'], dtype=object)
food[food["AKA Name"]=="subway"]["DBA Name"].unique()
array(['subway', 'subway sandwiches and salads', 'subway store # 25458',
'subway sandwiches & salads', 'subway 5183', 'subway 14641',
'the great state fare', 'c-k subway', 'subway 26199',
'subway-sandwich', 'subway #44541', 'subway sandwich & salads',
'sub way', 'sandwich & salad', 'subway sandwiches',
'subway sandwich shop', 'subway restaurant',
'subway sandwich & salad', 'subway # 26817-309 w. monroe',
'subway / tcby', 'subway 7709', 'subway 1121', 'subway #25073',
'subway 3634', 'subway store #30969', 'subway sandwich and salads',
'subway 10266', 'skyhigh-101', 'subway sanwich shop',
'subway #51581', 'subway #38326', 'subway subs and salads',
'subway sandwiches and salad', 'subway 50886',
'subway sandwiches & salad', 'subway restaurant #35406',
'subway 25064', 'lincoln ave subway', 'subway 275',
'subway at norwegian american hospital', 'subway #4267',
'subway sandwich', 'subway 24379', 'subway # 26771',
'subway #65029', 'tng enterprises, inc', 'subway / jay shree inc',
'suwbay', 'subway # 7659', 'wzumba inc', 'subway #24879'],
dtype=object)
food[food["AKA Name"]=="mcdonalds"]["DBA Name"].unique()
array(['mcdonalds', 'mcdonalds restaurant', 'pma mcd inc', "mcdonald's",
'mcdonalds restaurant # 14173', "hale family mcdonald's",
'mcdonalds #335'], dtype=object)
food[food["DBA Name"]=="mcdonalds"]["AKA Name"].unique()
array(['mcdonalds', 'mc donalds', "mcdonald's", 'mcdonalds '],
dtype=object)
From these examples we can see that it is easier to identify food chains’ establishments by their AKA Name
# remove punctuation
food["DBA Name"]=food["DBA Name"].str.replace(r'[^\w\s]+', '')
food["AKA Name"]=food["AKA Name"].str.replace(r'[^\w\s]+', '')
# One of our goals is to investigate food chains, so we'll try to group them according to their AKA Name
# Hardcode formatting for food chains
food["AKA Name"]=food["AKA Name"].str.replace("kentucky fried chicken", 'kfc')
food["AKA Name"]=food["AKA Name"].str.replace("mc donalds","mcdonalds")
food["AKA Name"]=food["AKA Name"].str.replace("mcdonalds restaurant","mcdonalds")
food["AKA Name"]=food["AKA Name"].str.replace("dominos pizza","dominos")
food["AKA Name"]=food["AKA Name"].str.replace("subway sandwiches","subway")
food["AKA Name"]=food["AKA Name"].str.replace("chipotle mexican grill","chipotle")
food["AKA Name"]=food["AKA Name"].str.replace("potbelly sandwich works", "potbelly")
food["AKA Name"]=food["AKA Name"].str.replace("potbelly sandwich works llc", "potbelly")
food["AKA Name"]=food["AKA Name"].str.replace("whole foods market","whole foods")
food["AKA Name"]=food["AKA Name"].str.replace("7eleven","7 eleven")
food["AKA Name"]=food["AKA Name"].str.replace("j j fish","jj fish chicken")
food["AKA Name"]=food["AKA Name"].str.replace("quiznos sub","quiznos")
food["AKA Name"]=food["AKA Name"].str.replace("starbucks coffee","starbucks")
food["AKA Name"]=food["AKA Name"].str.replace("donutsbaskin","donuts baskin")
food["AKA Name"]=food["AKA Name"].str.title()
food["AKA Name"]=food["AKA Name"].str.replace(" ","")
food["DBA Name"]=food["DBA Name"].str.strip()
We can’t talk about food in Chicago without mentionning their deep dish pizza, and namely two of their most famous venues: Giordano’s and Lou Malnati’s . So let’s add them
food[["Malnati" in aka for aka in food["AKA Name"]]]["AKA Name"].unique()
array(['LouMalnatisPizzeria', 'LouMalnatis'], dtype=object)
food["AKA Name"]=food["AKA Name"].str.replace('LouMalnatisPizzeria', 'LouMalnatis')
giordanos=food[["Giordano" in aka for aka in food["AKA Name"]]].index
food.loc[giordanos,"AKA Name"]="Giordanos"
# We look at establishments with the same AKA name and different adresses
food_chains=food.groupby("AKA Name").Address.nunique().sort_values(ascending=False)
# We will retain food chains with 10 or more establishments
food_chains=food_chains[food_chains>10]
#food_chains[food_chains<10].head(20)
food_chains
AKA Name
Subway 280
DunkinDonuts 159
7Eleven 110
Mcdonalds 108
Starbucks 101
Citgo 72
Cvs 69
DunkinDonutsBaskinRobbins 69
Walgreens 42
JimmyJohns 42
BurgerKing 42
Marathon 41
Bp 34
DollarTree 33
Chipotle 33
Kfc 31
GatewayNewstand 31
Dominos 30
FamilyDollar 29
Potbelly 26
Wendys 26
PizzaHut 26
HaroldsChicken 26
TacoBell 26
Freshii 23
Wingstop 22
AuBonPain 21
Shell 21
Giordanos 21
JjFishChicken 21
HaroldsChickenShack 20
Popeyes 20
LaMichoacana 18
SharksFishChicken 18
Mobil 18
CornerBakeryCafe 18
JambaJuice 16
PotbellyLlc 15
DollarGeneral 14
WholeFoods 14
Herbalife 14
Quiznos 14
PapaJohnsPizza 14
Target 13
SeeThruChineseKitchen 12
LouMalnatis 12
PretAManger 12
PeetsCoffeeTea 12
ArgoTea 12
ProteinBar 11
Pockets 11
HalstedStreetDeli 11
Name: Address, dtype: int64
from sklearn.metrics.pairwise import euclidean_distances
# We are interested in food chains that are rather spread out across the city, for that we will assess the pairwise
# distances of establishments within the same food chain
def food_chain_spread(food_chain):
location=food[food["AKA Name"]==food_chain][["Latitude","Longitude"]]
dist_mat=euclidean_distances(location,location)
return np.sum(dist_mat)/(len(location))
food_chain_spread("Subway")
436.22815124500346
spread=pd.Series(food_chains.index).apply(lambda x: food_chain_spread(x))
fc=pd.DataFrame({"Food_chain":food_chains.index,"number_of_establishments":food_chains.values,"spread":spread})
fc.sort_values("spread", ascending=False).head(10)
| Food_chain | number_of_establishments | spread | |
|---|---|---|---|
| 0 | Subway | 280 | 436.228151 |
| 3 | Mcdonalds | 108 | 282.205929 |
| 1 | DunkinDonuts | 159 | 156.132113 |
| 2 | 7Eleven | 110 | 100.732759 |
| 4 | Starbucks | 101 | 99.936245 |
| 7 | DunkinDonutsBaskinRobbins | 69 | 84.836581 |
| 10 | BurgerKing | 42 | 50.560232 |
| 20 | Wendys | 26 | 45.364857 |
| 15 | Kfc | 31 | 44.239157 |
| 14 | Chipotle | 33 | 40.600311 |
Unsuprisingly, fast food chains dominate the list